Categories
Papers Publications

new symposium paper “Visualizing Internet Measurements of Covid-19 Work-from-Home” at IEEE Symposium on REU Research in Data Science, Systems, and Security

We published a new paper “Visualizing Internet Measurements of Covid-19 Work-from-Home” by Erica Stutz (Swarthmore College), Yuri Pradkin, Xiao Song, and John Heidemann (USC/ISI) at the Symposium for REU Research in Data Science, Systems, and Security, co-located with IEEE BigData 2021.

A screenshot from our Covid-WFH website showing an event in Malaysia on 2020-04-02.
A change in Internet use seen in Malaysia on 2020-04-02, present in our Covid-WFH data but discovered through our website.

From the abstract:

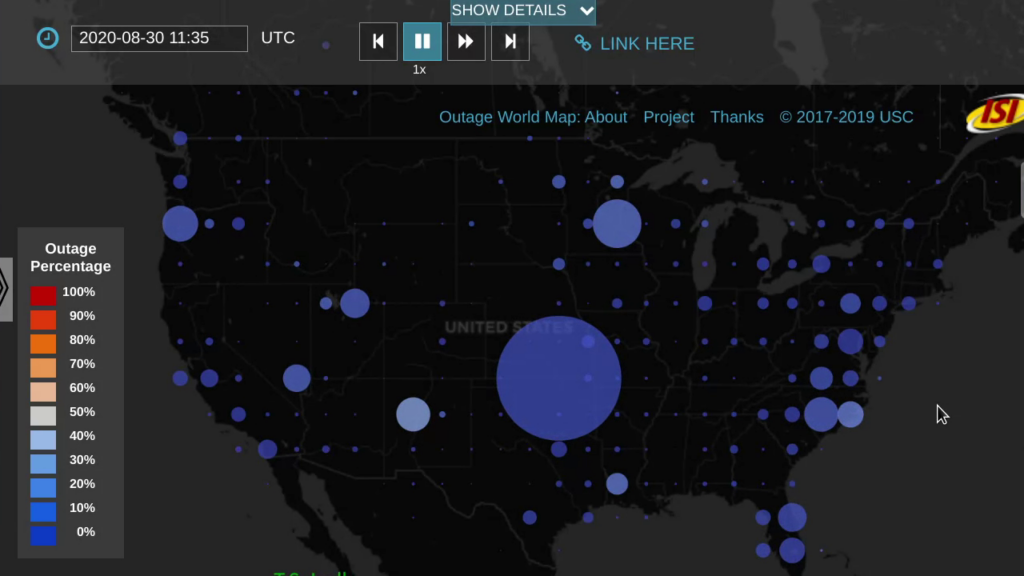
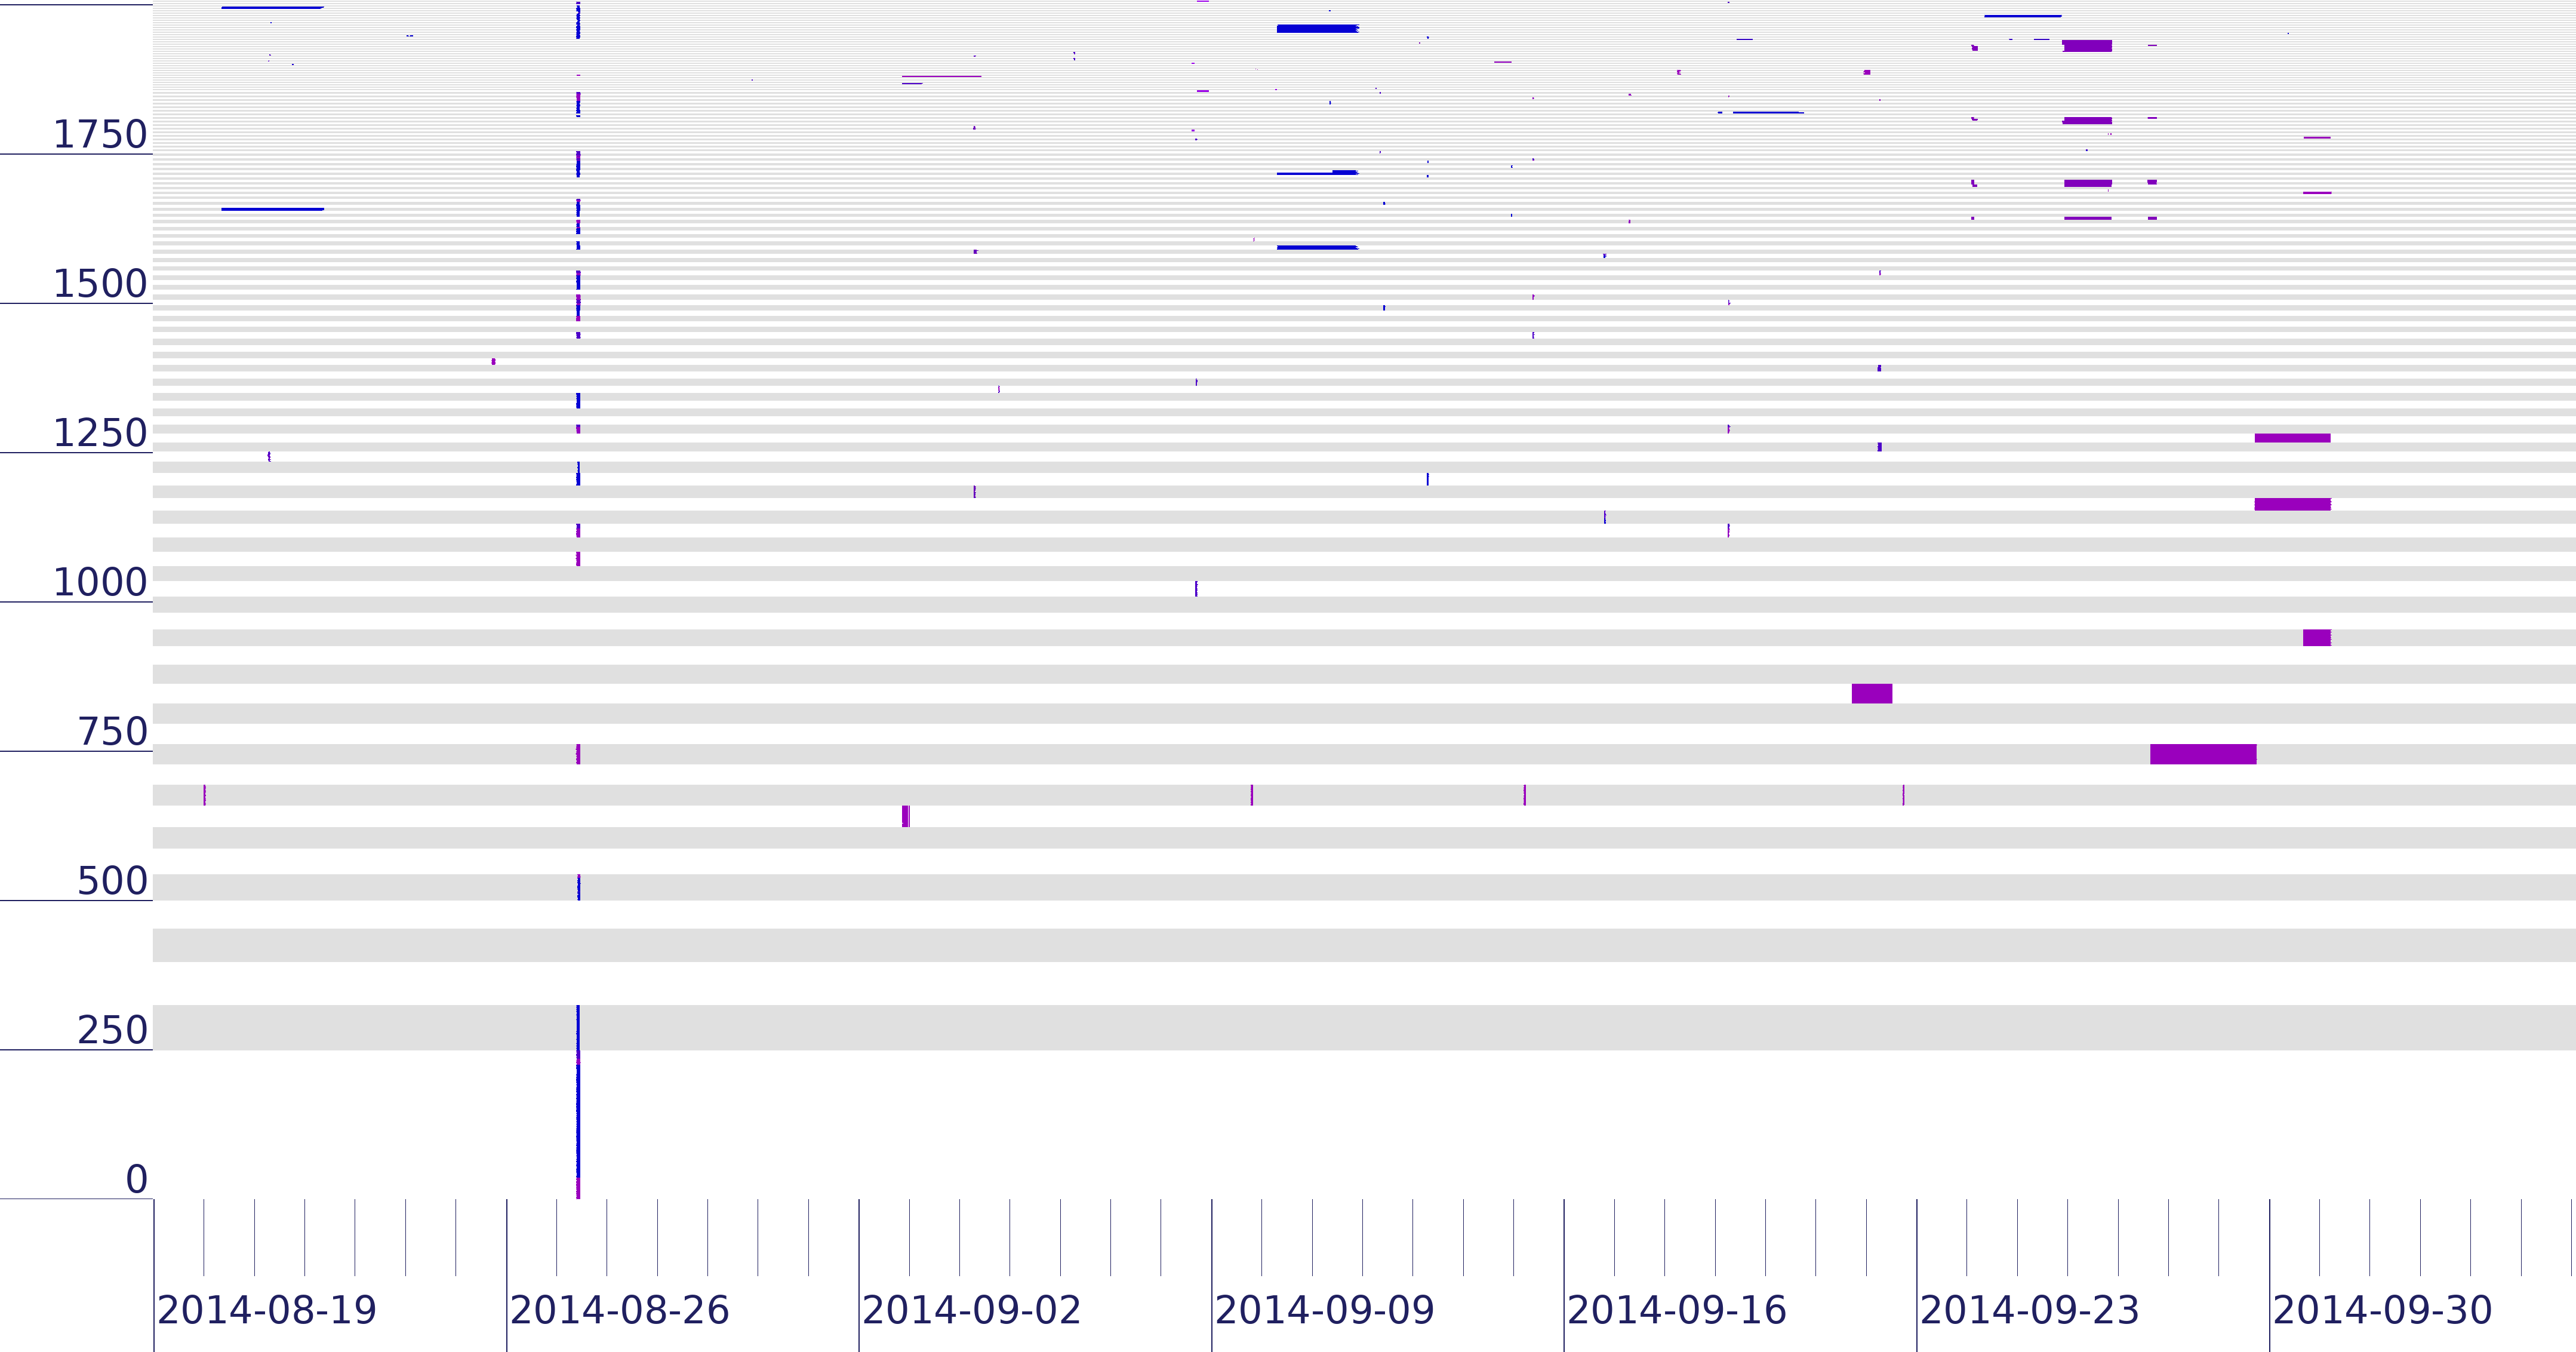
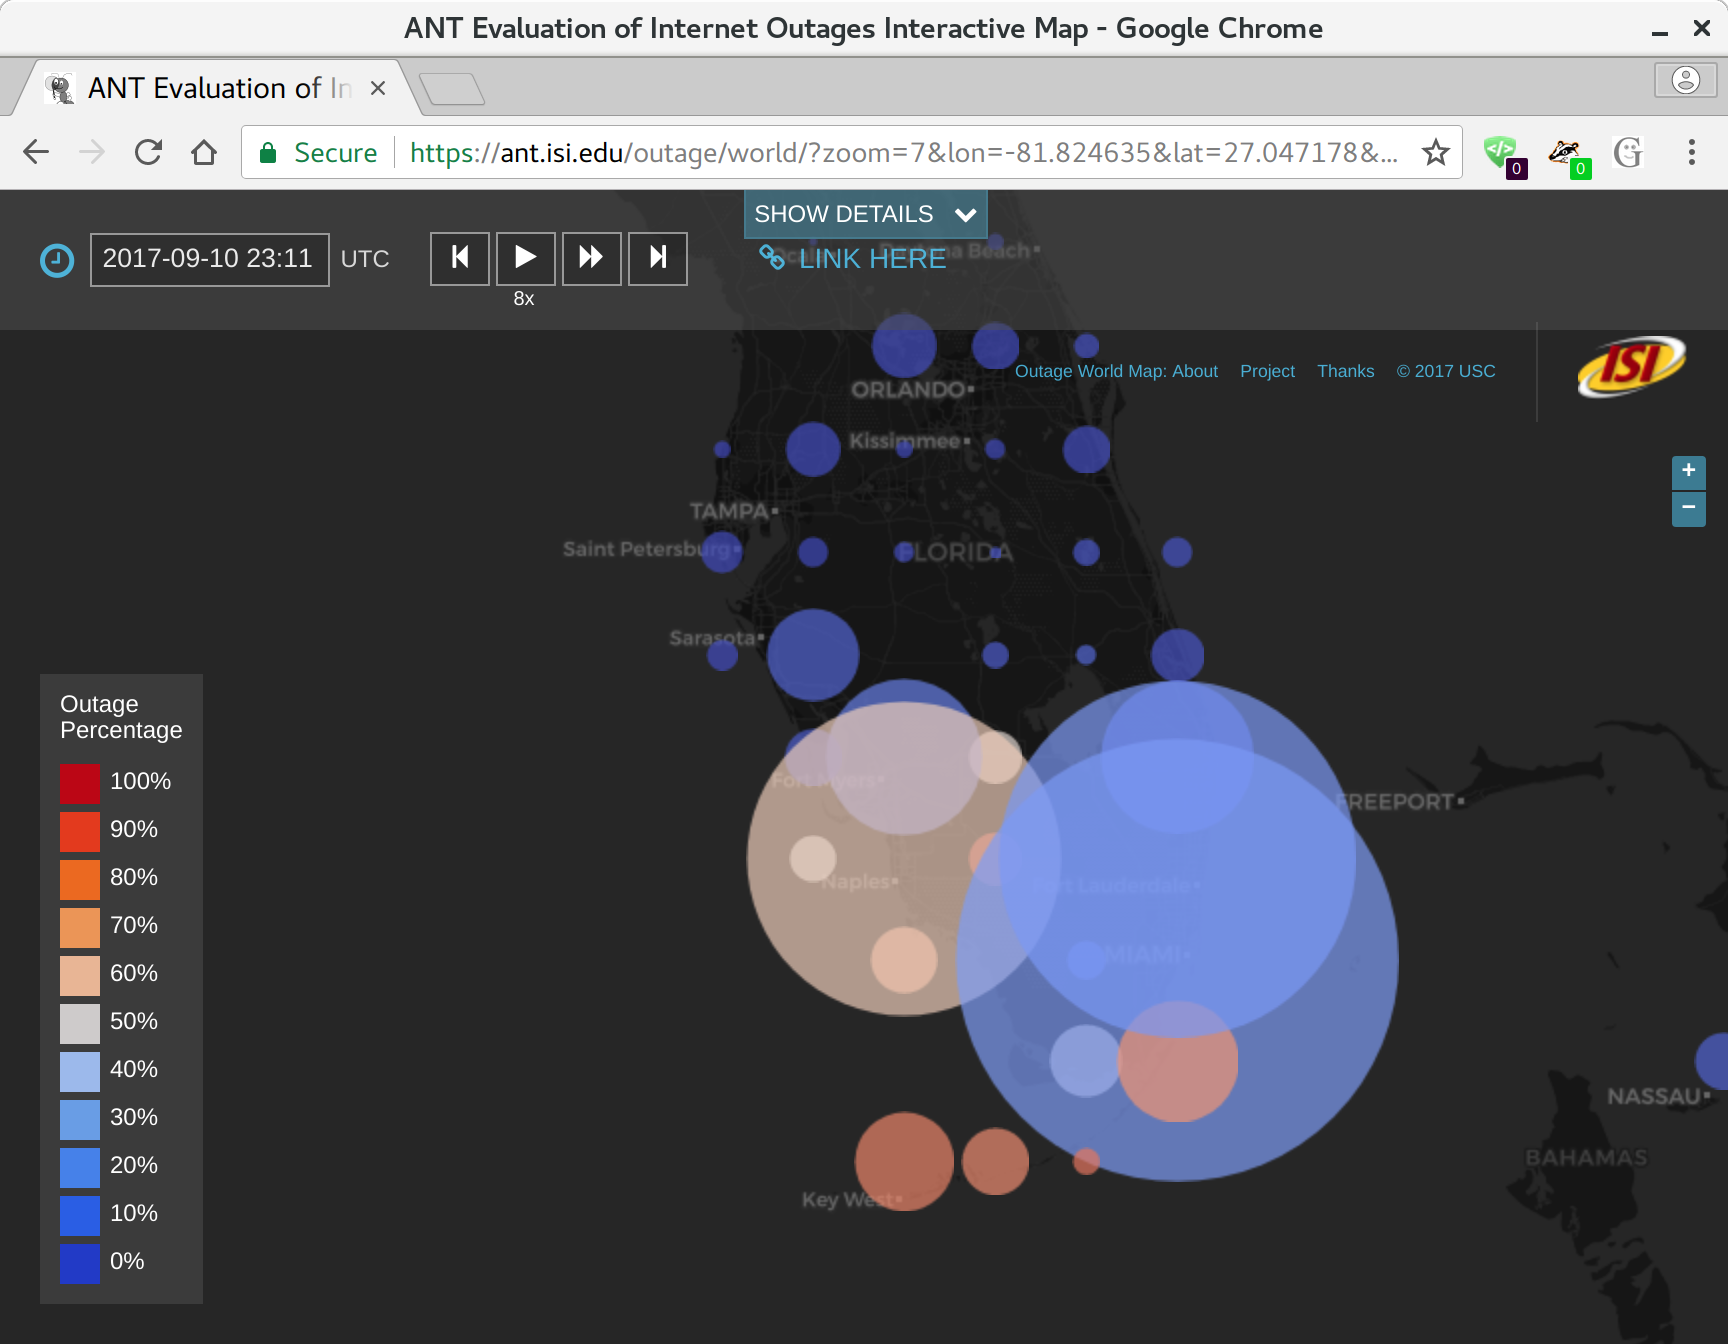
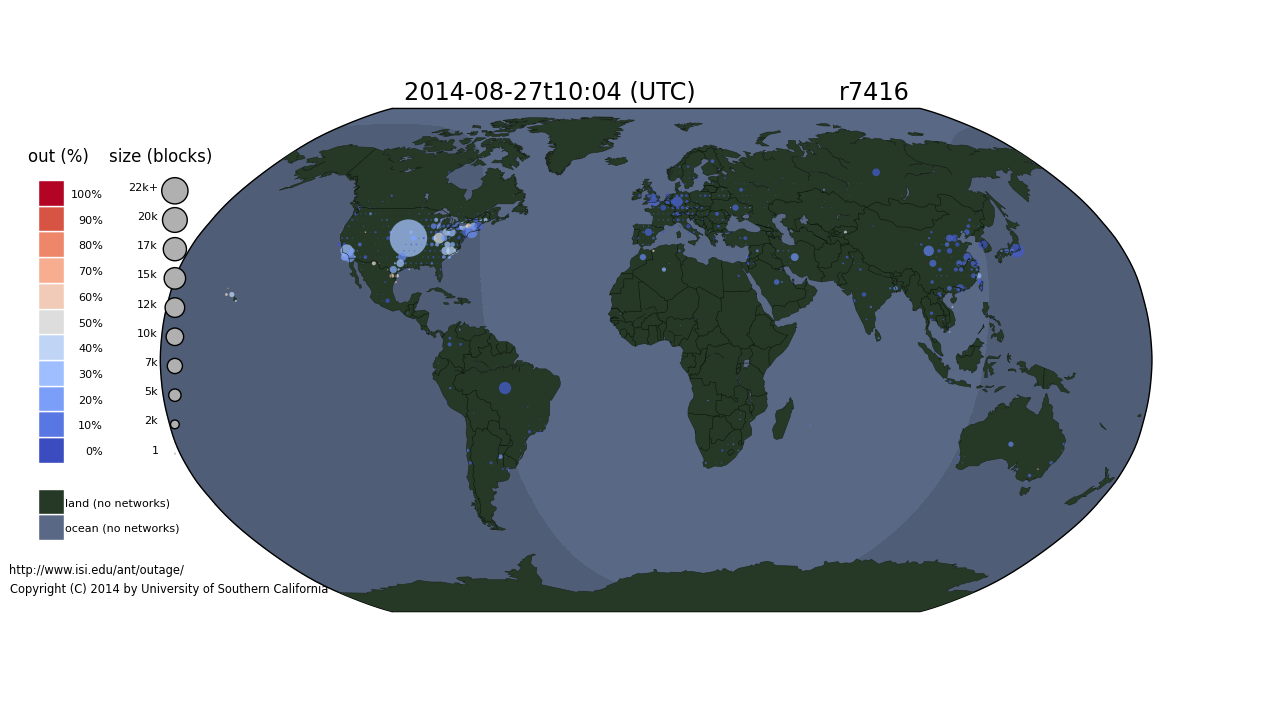
The Covid-19 pandemic disrupted the world as businesses and schools shifted to work-from-home (WFH), and comprehensive maps have helped visualize how those policies changed over time and in different places. We recently developed algorithms that infer the onset of WFH based on changes in observed Internet usage. Measurements of WFH are important to evaluate how effectively policies are implemented and followed, or to confirm policies in countries with less transparent journalism.This paper describes a web-based visualization system for measurements of Covid-19-induced WFH. We build on a web-based world map, showing a geographic grid of observations about WFH. We extend typical map interaction (zoom and pan, plus animation over time) with two new forms of pop-up information that allow users to drill-down to investigate our underlying data.We use sparklines to show changes over the first 6 months of 2020 for a given location, supporting identification and navigation to hot spots. Alternatively, users can report particular networks (Internet Service Providers) that show WFH on a given day.We show that these tools help us relate our observations to news reports of Covid-19-induced changes and, in some cases, lockdowns due to other causes. Our visualization is publicly available at https://covid.ant.isi.edu, as is our underlying data.

Datasets from this work will be available from our website and can be seen now at https://covid.ant.isi.edu. We thank NSF grants 2028279 and CNS-2007106 for supporting this work.

Categories
Internet Outages

Observing the CenturyLink outage on 2020-08-30

CenturyLink / Level3 was reported to have a major outage on Sunday, 2020-08-30 (as reported on CNN and discussed on slashdot).

This outage was very clear in our Trinocular near-real-time outage detection system. We have summarized the details with images, before, during, and after, and an animation of the nearly 7-hour event or see the event on our near-real-time outage website.

This outage is one of the largest U.S. nation-wide events since the 2014-08-27 Time Warner outage.

Categories
Announcements

reblogging: the diurnal Internet and DNS backscatter

We are happy to share that two of our older topics have appeared more recently in other venues.

Our animations of the diurnal Internet, originally seen in our 2014 ACM IMC paper and our blog posts, was noticed by Gerald Smith who used it to start a discussion with seventh-grade classes in Mahe, India and (I think) Indiana, USA as part of his Fullbright work. It’s great to see research work that useful to middle-schoolers!

Kensuke Fukuda recently posted about our work on identifying IPv6 scanning with DNS backscatter at the APNIC blog. This work was originally published at the 2018 ACM IMC and posted in our blog. It’s great to see that work get out to a new audience.

Categories
Presentations

new talk “Internet Outages: Reliablity and Security” from U. of Oregon Cybersecurity Day 2018

John Heidemann gave the talk “Internet Outages: Reliablity and Security” at the University of Oregon Cybersecurity Day in Eugene, Oregon on April 23, 2018.  Slides are available at https://www.isi.edu/~johnh/PAPERS/Heidemann18e.pdf.

Network outages as a security problem.

From the abstract:

The Internet is central to our lives, but we know astoundingly little about it. Even though many businesses and individuals depend on it, how reliable is the Internet? Do policies and practices make it better in some places than others?

Since 2006, we have been studying the public face of the Internet to answer these questions. We take regular censuses, probing the entire IPv4 Internet address space. For more than two years we have been observing Internet reliability through active probing with Trinocular outage detection, revealing the effects of the Internet due to natural disasters like Hurricanes from Sandy to Harvey and Maria, configuration errors that sometimes affect millions of customers, and political events where governments have intervened in Internet operation. This talk will describe how it is possible to observe Internet outages today and what they are beginning to say about the Internet and about the physical world.

This talk builds on research over the last decade in IPv4 censuses and outage detection and includes the work of many of my collaborators.

Data from this talk is all available; see links on the last slide.

Categories
Announcements Projects

new project “Interactive Internet Outages Visualization to Assess Disaster Recovery”

We are happy to announce a new project, Interactive Internet Outages Visualization to Assess Disaster Recovery.   This project is supporting the use of Internet outage measurements to help understand and recover from natural disasters. It will expand on the visualization of Internet outages found at https://ant.isi.edu/outage/world/.

This visualization was initially seeded by a Michael Keston research grant here at ISI, and the outage measurement techniques and ongoing data collection has been developed with the support of DHS (the LANDER-2007, LACREND, LACANIC, and Retro-future Bridge and Outages projects).

Categories
Publications Technical Report

new technical report “Back Out: End-to-end Inference of Common Points-of-Failure in the Internet (extended)”

We released a new technical report “Back Out: End-to-end Inference of Common Points-of-Failure in the Internet (extended)”, ISI-TR-724, available at https://www.isi.edu/~johnh/PAPERS/Heidemann18b.pdf.

From the abstract:

Clustering (from our event clustering algorithm) of 2014q3 outages from 172/8, showing 7 weeks including the 2014-08-27 Time Warner outage.

Internet reliability has many potential weaknesses: fiber rights-of-way at the physical layer, exchange-point congestion from DDOS at the network layer, settlement disputes between organizations at the financial layer, and government intervention the political layer. This paper shows that we can discover common points-of-failure at any of these layers by observing correlated failures. We use end-to-end observations from data-plane-level connectivity of edge hosts in the Internet. We identify correlations in connectivity: networks that usually fail and recover at the same time suggest common point-of-failure. We define two new algorithms to meet these goals. First, we define a computationally-efficient algorithm to create a linear ordering of blocks to make correlated failures apparent to a human analyst. Second, we develop an event-based clustering algorithm that directly networks with correlated failures, suggesting common points-of-failure. Our algorithms scale to real-world datasets of millions of networks and observations: linear ordering is O(n log n) time and event-based clustering parallelizes with Map/Reduce. We demonstrate them on three months of outages for 4 million /24 network prefixes, showing high recall (0.83 to 0.98) and precision (0.72 to 1.0) for blocks that respond. We also show that our algorithms generalize to identify correlations in anycast catchments and routing.

Datasets from this paper are available at no cost and are listed at https://ant.isi.edu/datasets/outage/, and we expect to release the software for this paper in the coming months (contact us if you are interested).

Categories
Announcements Outages

new website for browsing Internet outages

We are happy to announce a new website at https://ant.isi.edu/outage/world/ that supports our Internet outage data collected from Trinocular.

The ANT Outage world browser, showing Hurricane Irma just after landfall in Florida in Sept. 2017.

Our website supports browsing more than two years of outage data, organized by geography and time.  The map is a google-maps-style world map, with circle on it at even intervals (every 0.5 to 2 degrees of latitude and longitude, depending on the zoom level).  Circle sizes show how many /24 network blocks are out in that location, while circle colors show the percentage of outages, from blue (only a few percent) to red (approaching 100%).

We hope that this website makes our outage data more accessible to researchers and the public.

The raw data underlying this website is available on request, see our outage dataset webpage.

The research is funded by the Department of Homeland Security (DHS) Cyber Security Division (through the LACREND and Retro-Future Bridge and Outages projects) and Michael Keston, a real estate entrepreneur and philanthropist (through the Michael Keston Endowment).  Michael Keston helped support this the initial version of this website, and DHS has supported our outage data collection and algorithm development.

The website was developed by Dominik Staros, ISI web developer and owner of Imagine Web Consulting, based on data collected by ISI researcher Yuri Pradkin. It builds on prior work by Pradkin, Heidemann and USC’s Lin Quan in ISI’s Analysis of Network Traffic Lab.

ISI has featured our new website on the ISI news page.


Categories
Presentations

new talk “Collecting and Visualizing Outages Over the Long Haul” at the AIMS Workshop 2017

John Heidemann gave the talk “Collecting and Visualizing Outages Over the Long Haul” at CAIDA’s Active Internet Measurement (AIMS) Workshop in San Diego, California, USA on March 2, 2017.  Slides are available at http://www.isi.edu/~johnh/PAPERS/Heidemann17b.pdf.
From the abstract:

Unmeasurable blocks over time, a challenge in long-haul outage measurement, from [Alwabel15a]
We have been collecting data about outages in the Internet since Oct. 2014. Our outage detection system, Trinocular, uses active probing from four sites to study about 4 million /24 IPv4 address blocks. Long-duration measurements bring challenges that don’t occur in short observations. Most importantly, our target (“the Internet”) changes as we measure it, as new blocks come on-line, old blocks are reused in different ways, and ISPs observe and sometimes block our traffic. Our measurement platform also sees occasional hardware failures. Visualization can assist detection of these problems, allowing human perception to detect changes in data collection that have not previously been anticipated. This talk will discuss the challenges of long-term outage measurement and describe our new algorithm that scales to support clustering of 4M blocks and 3 months of observations for visualization.
Our visualization is joint work with Yuri Pradkin, and analysis of our long-term outages includes work with Abdulla Alwabel.

This talk draws on work from [Alwabel15a].  Data from this talk is available at https://ant.isi.edu/datasets/outage/, and visualizations can be found at https://ant.isi.edu/outage/browse/.

Categories
Presentations

new animation: the August 2014 Time Warner outage

Global network outages on 2014-08-27 during the Time Warner event in the U.S.

On August 27, 2014, Time Warner suffered a network outage that affected about 11 million customers for more than two hours (making national news). We have observing global network outages since December 2013, including this outage.

We recently animated this August Time Warner outage.

We see that the Time Warner outage lasted about two hours and affected a good swath of the United States. We caution that all large network operators have occasional outages–this animation is not intended to complain about Time Warner, but to illustrate the need to have tools that can detect and visualize national-level outages.  It also puts the outage into context: we can see a few other outages in Uruguay, Brazil, and Saudi Arabia.

This analysis uses dataset usc-lander /internet_outage_adaptive_a17all-20140701, available for research use from PREDICT, or by request from us if PREDICT access is not possible.

This animation was first shown at the Dec. 2014 DHS Cyber Security Division R&D Showcase and Technical Workshop as part of the talk “Towards Understanding Internet Reliability” given by John Heidemann. This work was supported by DHS, most recently through the LACREND project.

Categories
Presentations

new animation: a sample of U.S. networks, before and after Hurricane Sandy

In October 2012, Hurricane Sandy made landfall on the U.S. East Coast causing widespread power outages. We were able to see the effects of Hurricane Sandy by analyzing active probing of the Internet. We first reported this work in a technical report and then with more refined analysis in a peer-reviewed paper.

Network outages for a sample of U.s. East Coast networks on the day after Hurricane Sandy made landfall.

We recently animated our data showing Hurricane Sandy landfall.

These 4 days before landfall and 7 after show some intersting results: On the day of landfall we see about three-times the number of outages relative to “typical” U.S. networks. Finally, we see it takes about four days to recover back to typical conditions.

This analysis uses dataset usc-lander / internet_address_survey_reprobing_it50j, available for research use from PREDICT, or by request from us if PREDICT access is not possible.

This animation was first shown at the Dec. 2014 DHS Cyber Security Division R&D Showcase and Technical Workshop as part of the talk “Towards Understanding Internet Reliability” given by John Heidemann. This work was supported by DHS, most recently through the LACREND project.