Categories
Presentations

new animation: the August 2014 Time Warner outage

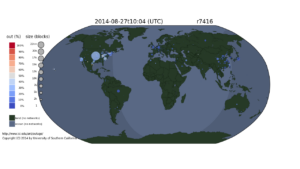
Global network outages on 2014-08-27 during the Time Warner event in the U.S.

On August 27, 2014, Time Warner suffered a network outage that affected about 11 million customers for more than two hours (making national news). We have observing global network outages since December 2013, including this outage.

We recently animated this August Time Warner outage.

We see that the Time Warner outage lasted about two hours and affected a good swath of the United States. We caution that all large network operators have occasional outages–this animation is not intended to complain about Time Warner, but to illustrate the need to have tools that can detect and visualize national-level outages.  It also puts the outage into context: we can see a few other outages in Uruguay, Brazil, and Saudi Arabia.

This analysis uses dataset usc-lander /internet_outage_adaptive_a17all-20140701, available for research use from PREDICT, or by request from us if PREDICT access is not possible.

This animation was first shown at the Dec. 2014 DHS Cyber Security Division R&D Showcase and Technical Workshop as part of the talk “Towards Understanding Internet Reliability” given by John Heidemann. This work was supported by DHS, most recently through the LACREND project.
Categories
Presentations

new animation: a sample of U.S. networks, before and after Hurricane Sandy

In October 2012, Hurricane Sandy made landfall on the U.S. East Coast causing widespread power outages. We were able to see the effects of Hurricane Sandy by analyzing active probing of the Internet. We first reported this work in a technical report and then with more refined analysis in a peer-reviewed paper.

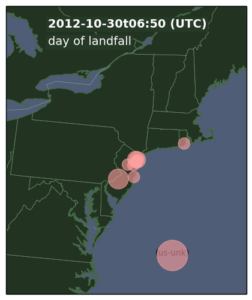
Network outages for a sample of U.s. East Coast networks on the day after Hurricane Sandy made landfall.

We recently animated our data showing Hurricane Sandy landfall.

These 4 days before landfall and 7 after show some intersting results: On the day of landfall we see about three-times the number of outages relative to “typical” U.S. networks. Finally, we see it takes about four days to recover back to typical conditions.

This analysis uses dataset usc-lander / internet_address_survey_reprobing_it50j, available for research use from PREDICT, or by request from us if PREDICT access is not possible.

This animation was first shown at the Dec. 2014 DHS Cyber Security Division R&D Showcase and Technical Workshop as part of the talk “Towards Understanding Internet Reliability” given by John Heidemann. This work was supported by DHS, most recently through the LACREND project.