The ANT Project blog has moved from http://www.isi.edu/ant/blog to it’s new location at http://ant.isi.edu/blog/
If you’re watching the blog via RSS, you may want to update your feedreader.
The ANT Project blog has moved from http://www.isi.edu/ant/blog to it’s new location at http://ant.isi.edu/blog/
If you’re watching the blog via RSS, you may want to update your feedreader.
The paper “Towards Geolocation of Millions of IP Addresses” was accepted by IMC 2012 in Boston, MA (available at http://www.isi.edu/~johnh/PAPERS/Hu12a.html).
From the abstract:
Previous measurement-based IP geolocation algorithms have focused on accuracy, studying a few targets with increasingly sophisticated algorithms taking measurements from tens of vantage points (VPs). In this paper, we study how to scale up existing measurement-based geolocation algorithms like Shortest Ping and CBG to cover the whole Internet. We show that with many vantage points, VP proximity to the target is the most important factor affecting accuracy. This observation suggests our new algorithm that selects the best few VPs for each target from many candidates. This approach addresses the main bottleneck to geolocation scalability: minimizing traffic into each target (and also out of each VP) while maintaining accuracy. Using this approach we have currently geolocated about 35% of the allocated, unicast, IPv4 address-space (about 85% of the addresses in the Internet that can be directly geolocated). We visualize our geolocation results on a web-based address-space browser.
Citation: Zi Hu and John Heidemann and Yuri Pradkin. Towards Geolocation of Millions of IP Addresses. In Proceedings of the ACM Internet Measurement Conference, p. to appear. Boston, MA, USA, ACM. 2012. <http://www.isi.edu/~johnh/PAPERS/Hu12a.html>

The paper “Visualizing Sparse Internet Events: Network Outages and Route Changes” was accepted by WIV’12 in Boston, MA (available at http://www.isi.edu/~johnh/PAPERS/Quan12b.html).
From the abstract:
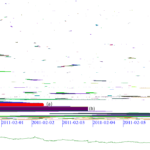
To understand network behavior, researchers and enterprise network operators must interpret large amounts of network data. To understand and manage network events such as outages, route instability, and spam campaigns, they must interpret data that covers a range of networks and evolves over time. We propose a simple clustering algorithm that helps identify spatial clusters of network events based on correlations in event timing, producing 2-D visualizations. We show that these visualizations where they reveal the extent, timing, and dynamics of network outages such as January 2011 Egyptian change of government, and the March 2011 Japanese earthquake. We also show they reveal correlations in routing changes that are hidden from AS-path analysis.
Citation: Lin Quan and John Heidemann and Yuri Pradkin. Visualizing Sparse Internet Events: Network Outages and Route Changes. In Proceedings of the First ACM Workshop on Internet Visualization. Boston, MA. November, 2012. <http://www.isi.edu/~johnh/PAPERS/Quan12b.html>.