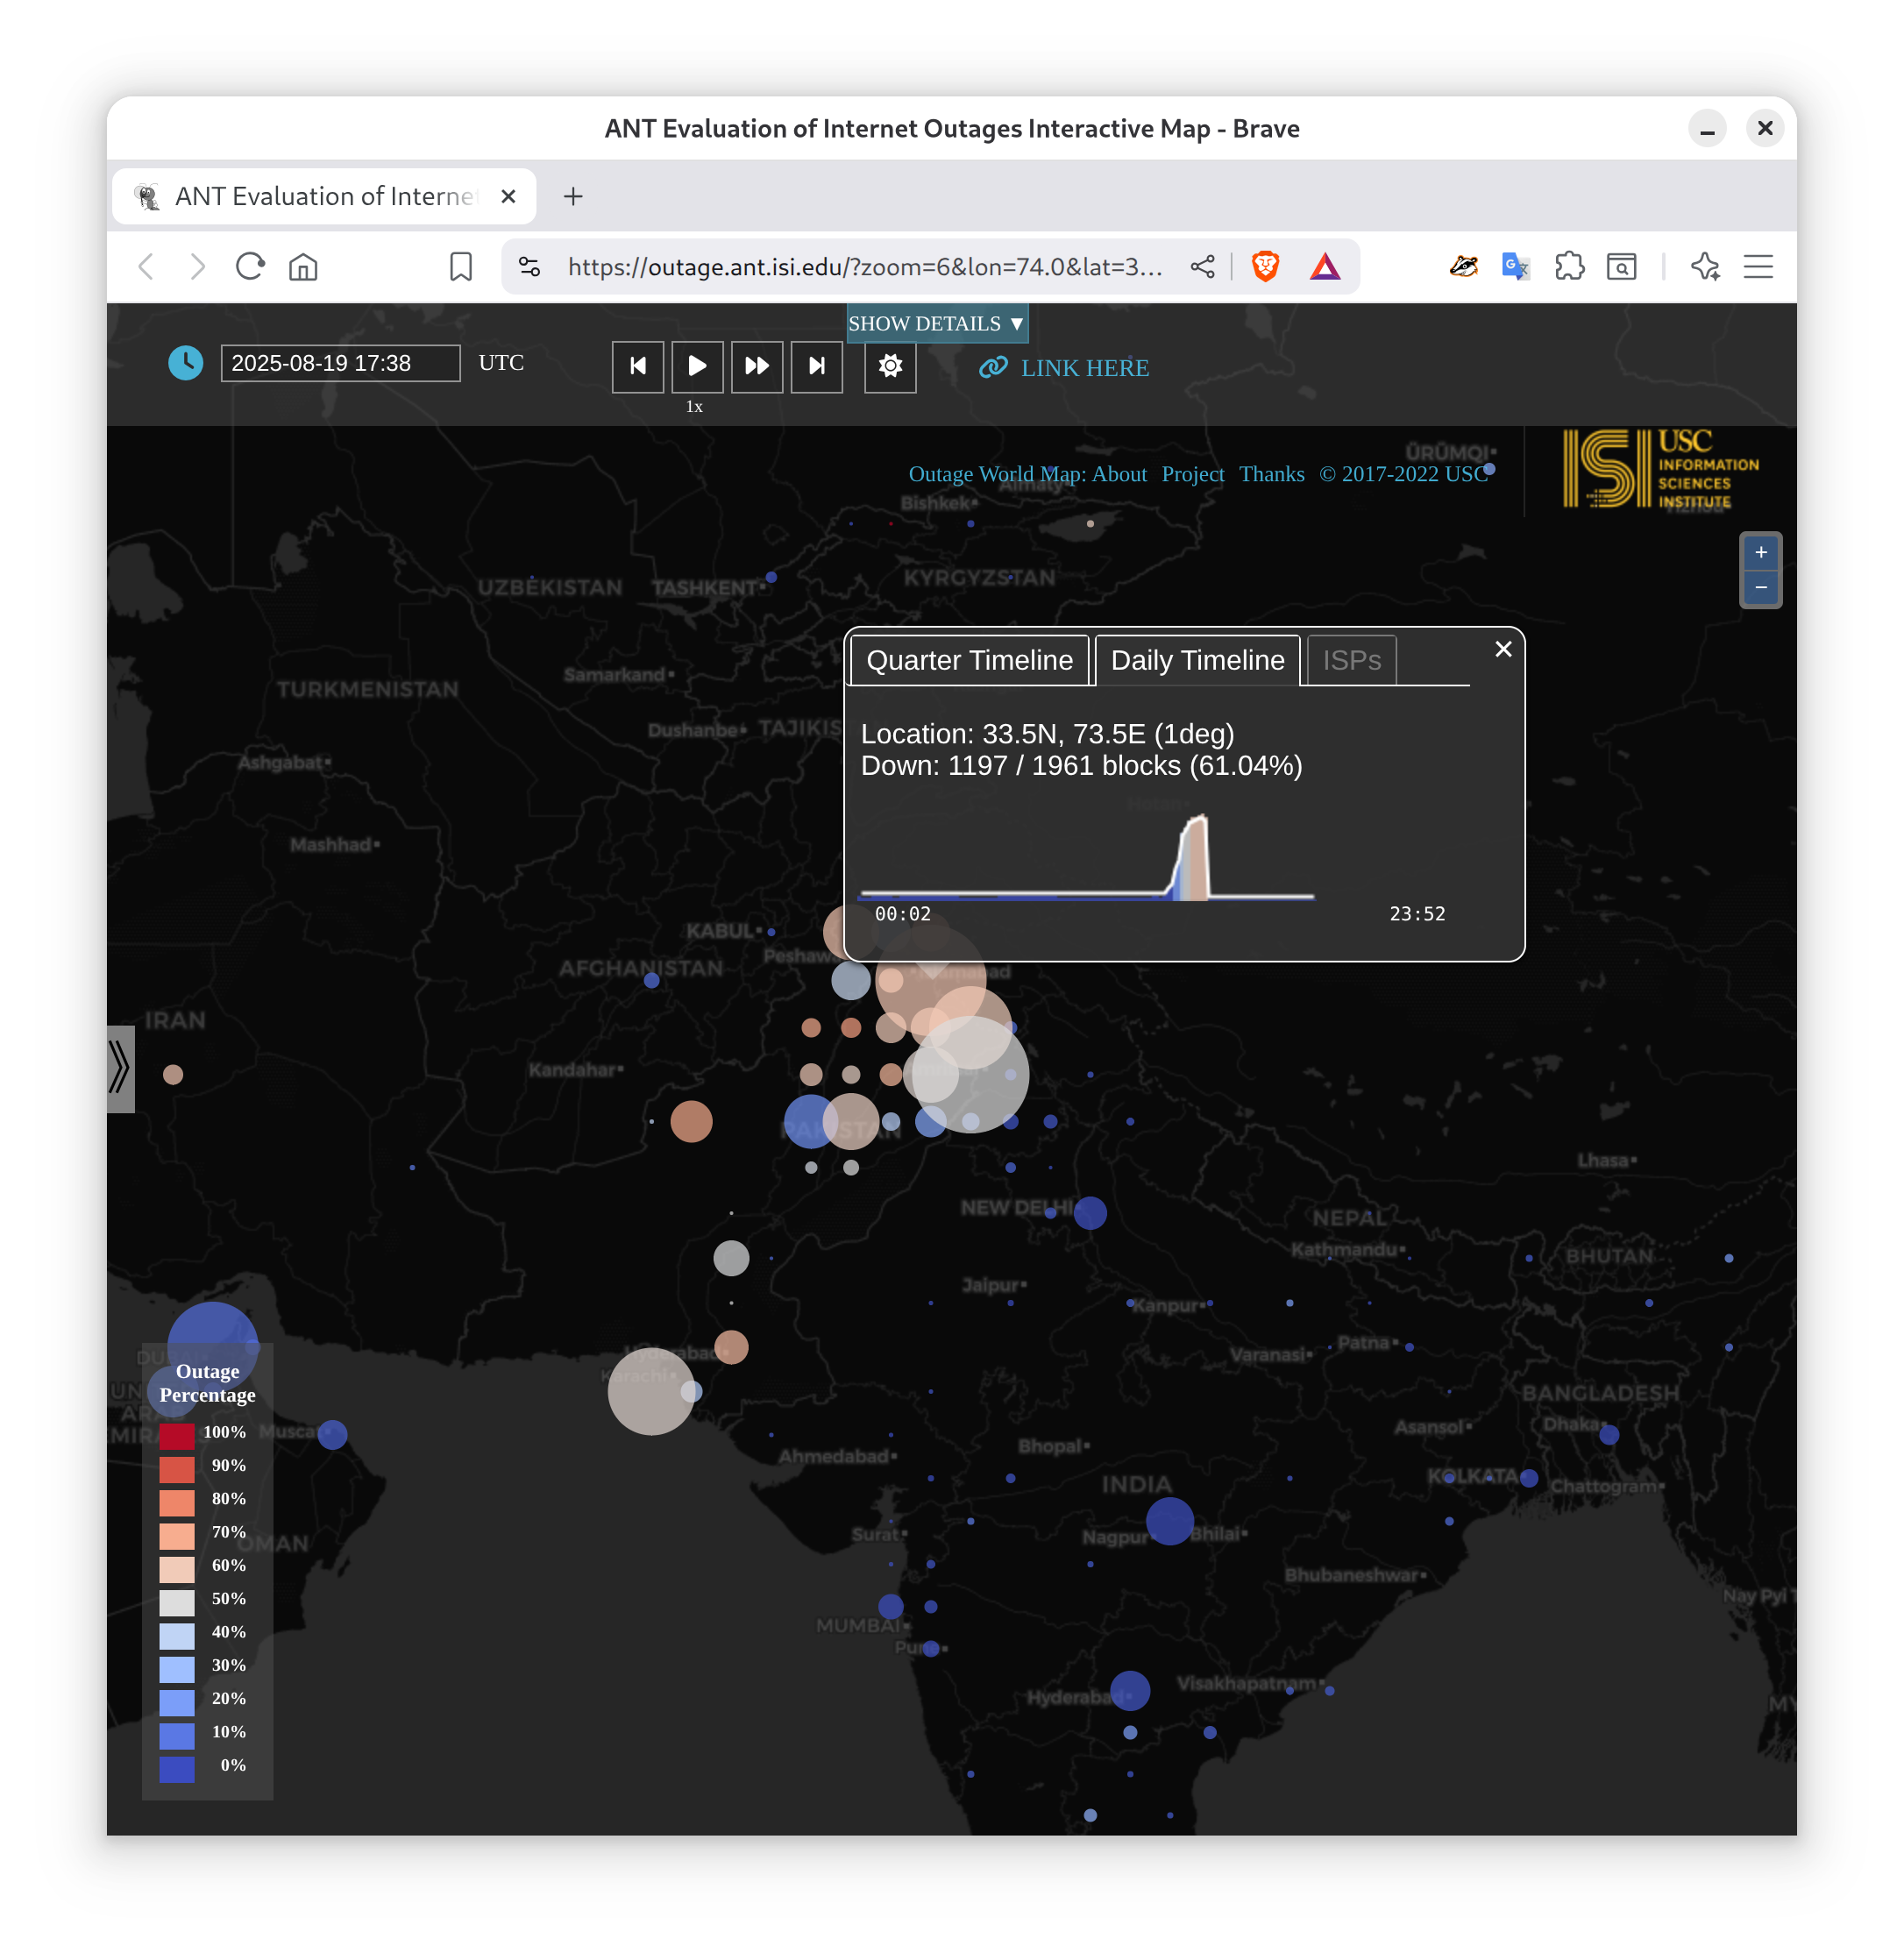
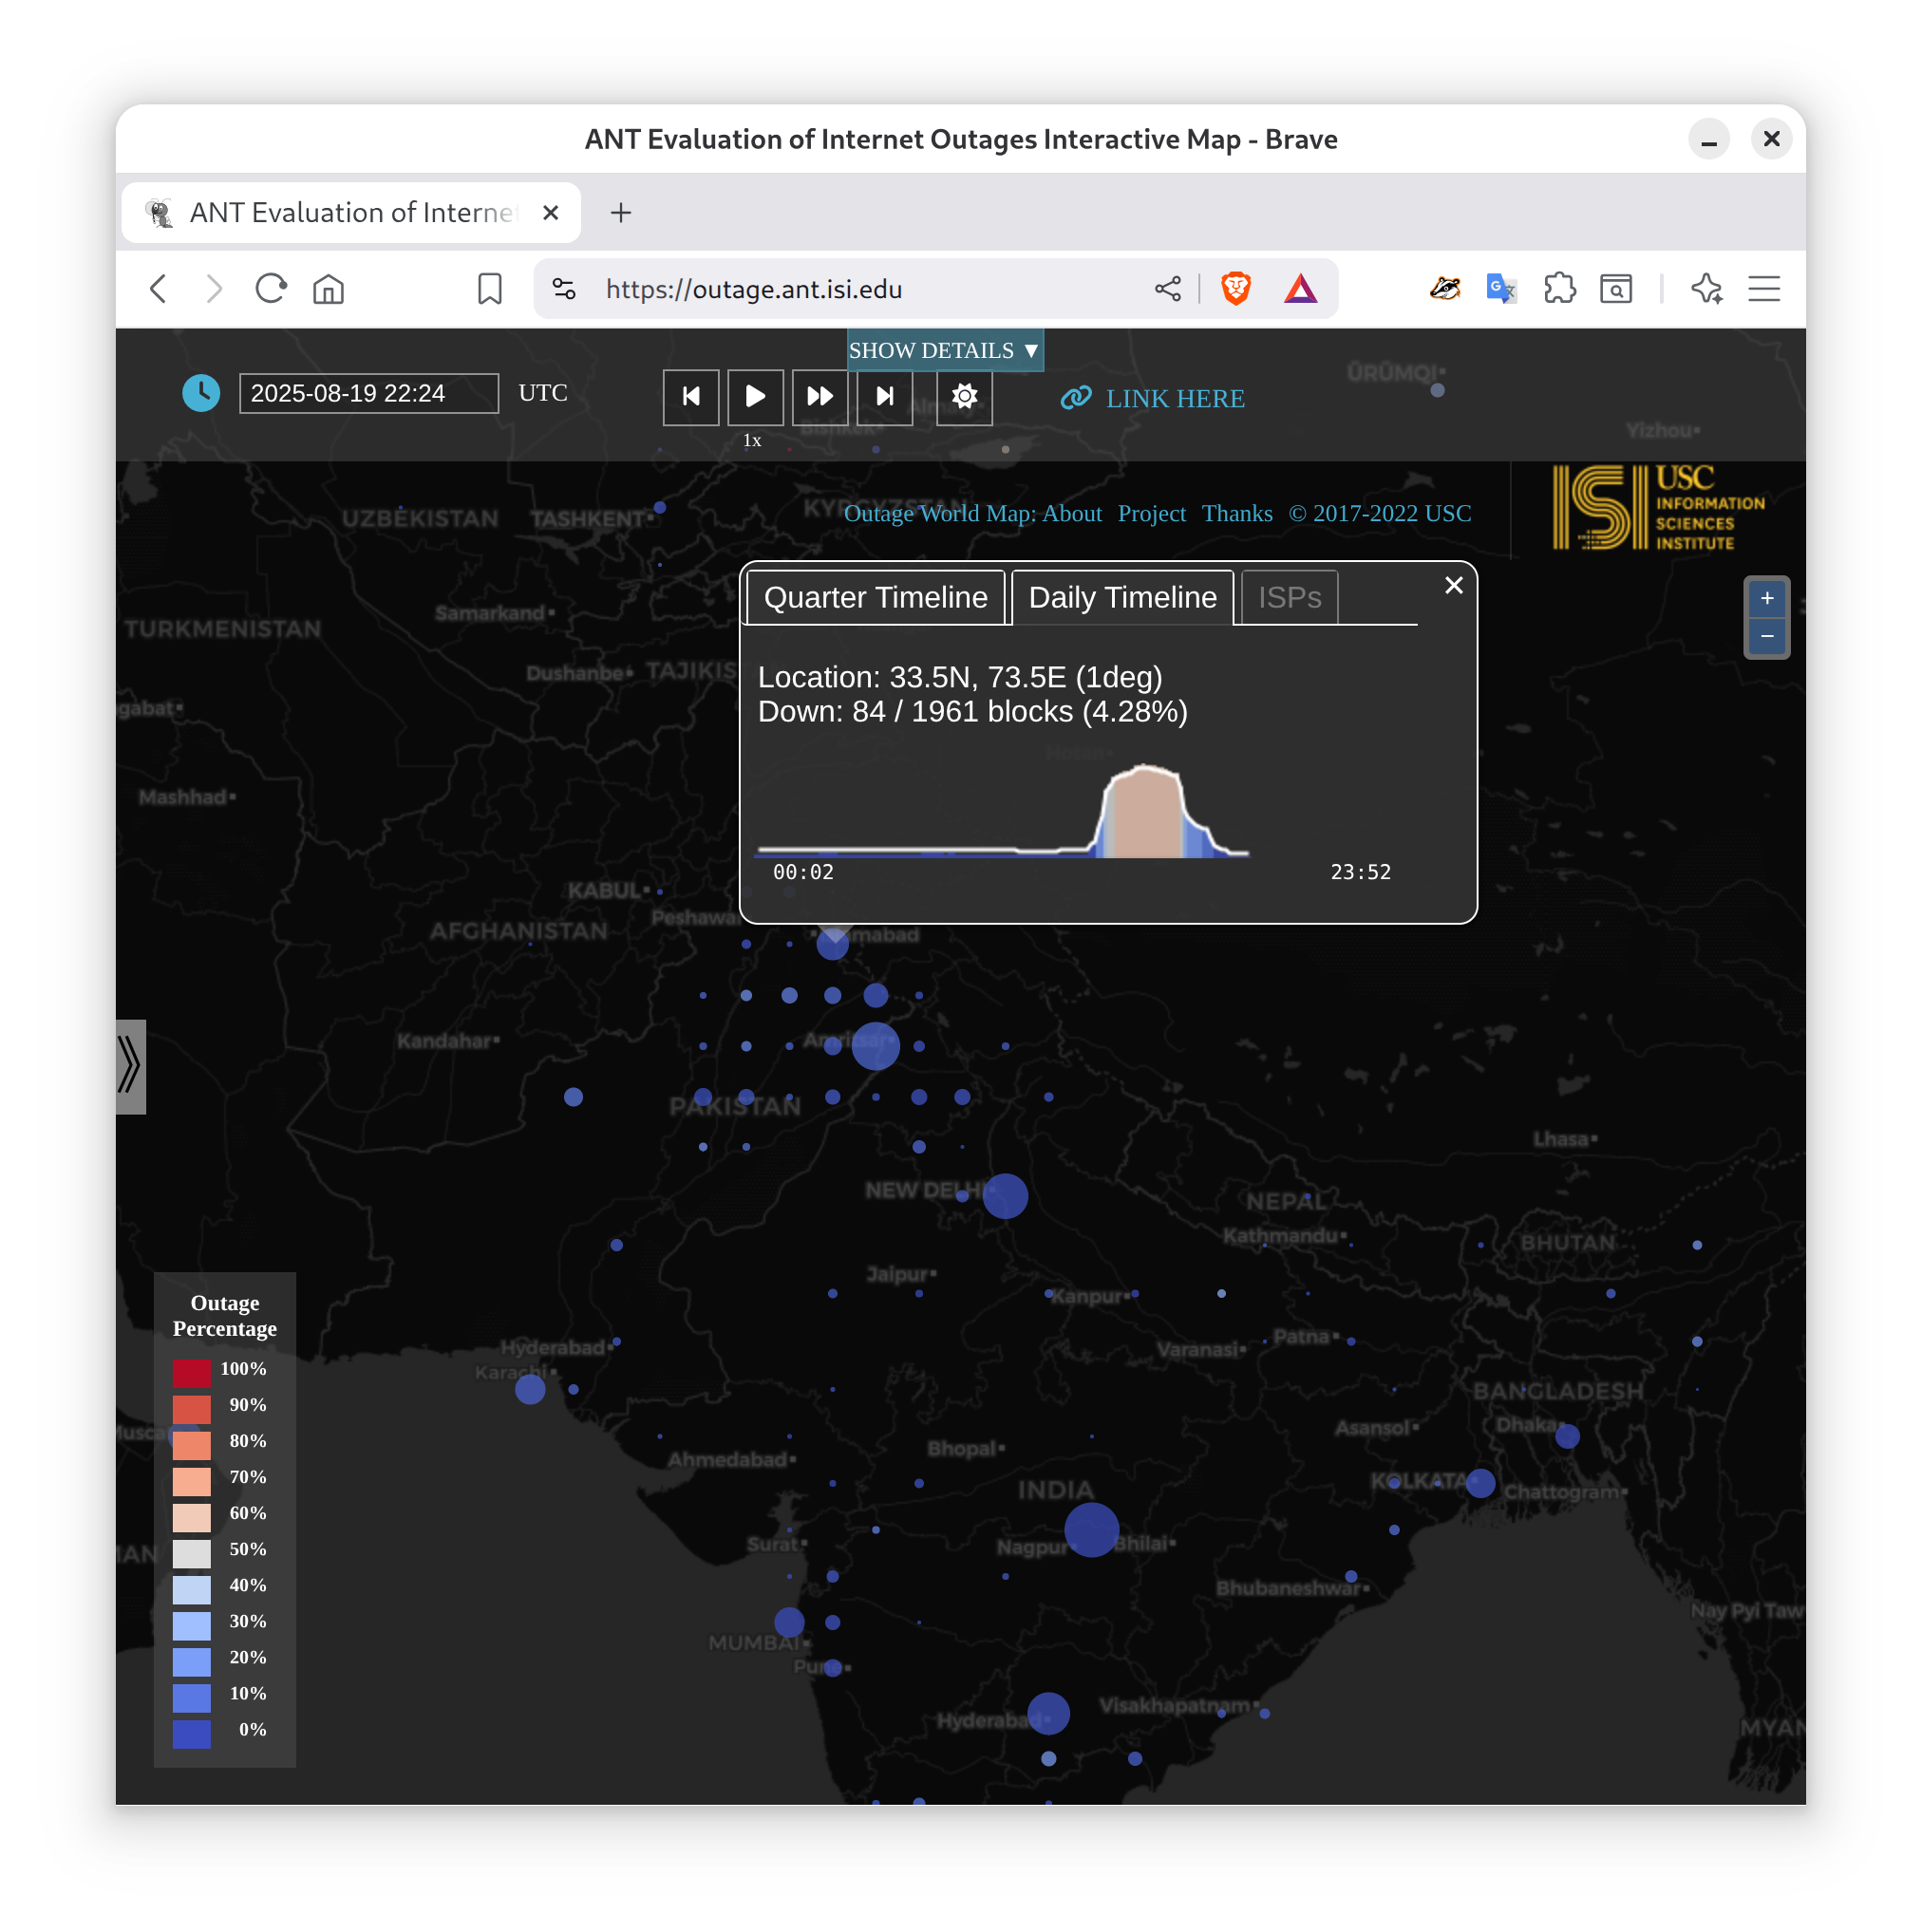
Starting shortly before 2025-08-19t17:05Z (10:05pm August 19 local time in Pakistan), a very large Internet outage occurred across all of Pakistan. Although not affecting all networks, in many areas 50% or more fo the networks are down, as shown in the following map:
We saw the first outages at 16:30Z, and they quickly ramped up to about half of the networks in most of the country. Since the network outages closely follow the country’s borders, it seems unlikely that this is a weather-related event. As of the time of this post (t20:00Z), the outage appears to be ongoing. We’ll post an update here when we learn more.
Some reports are suggesting it’s a backbone outage caused due to flooding.
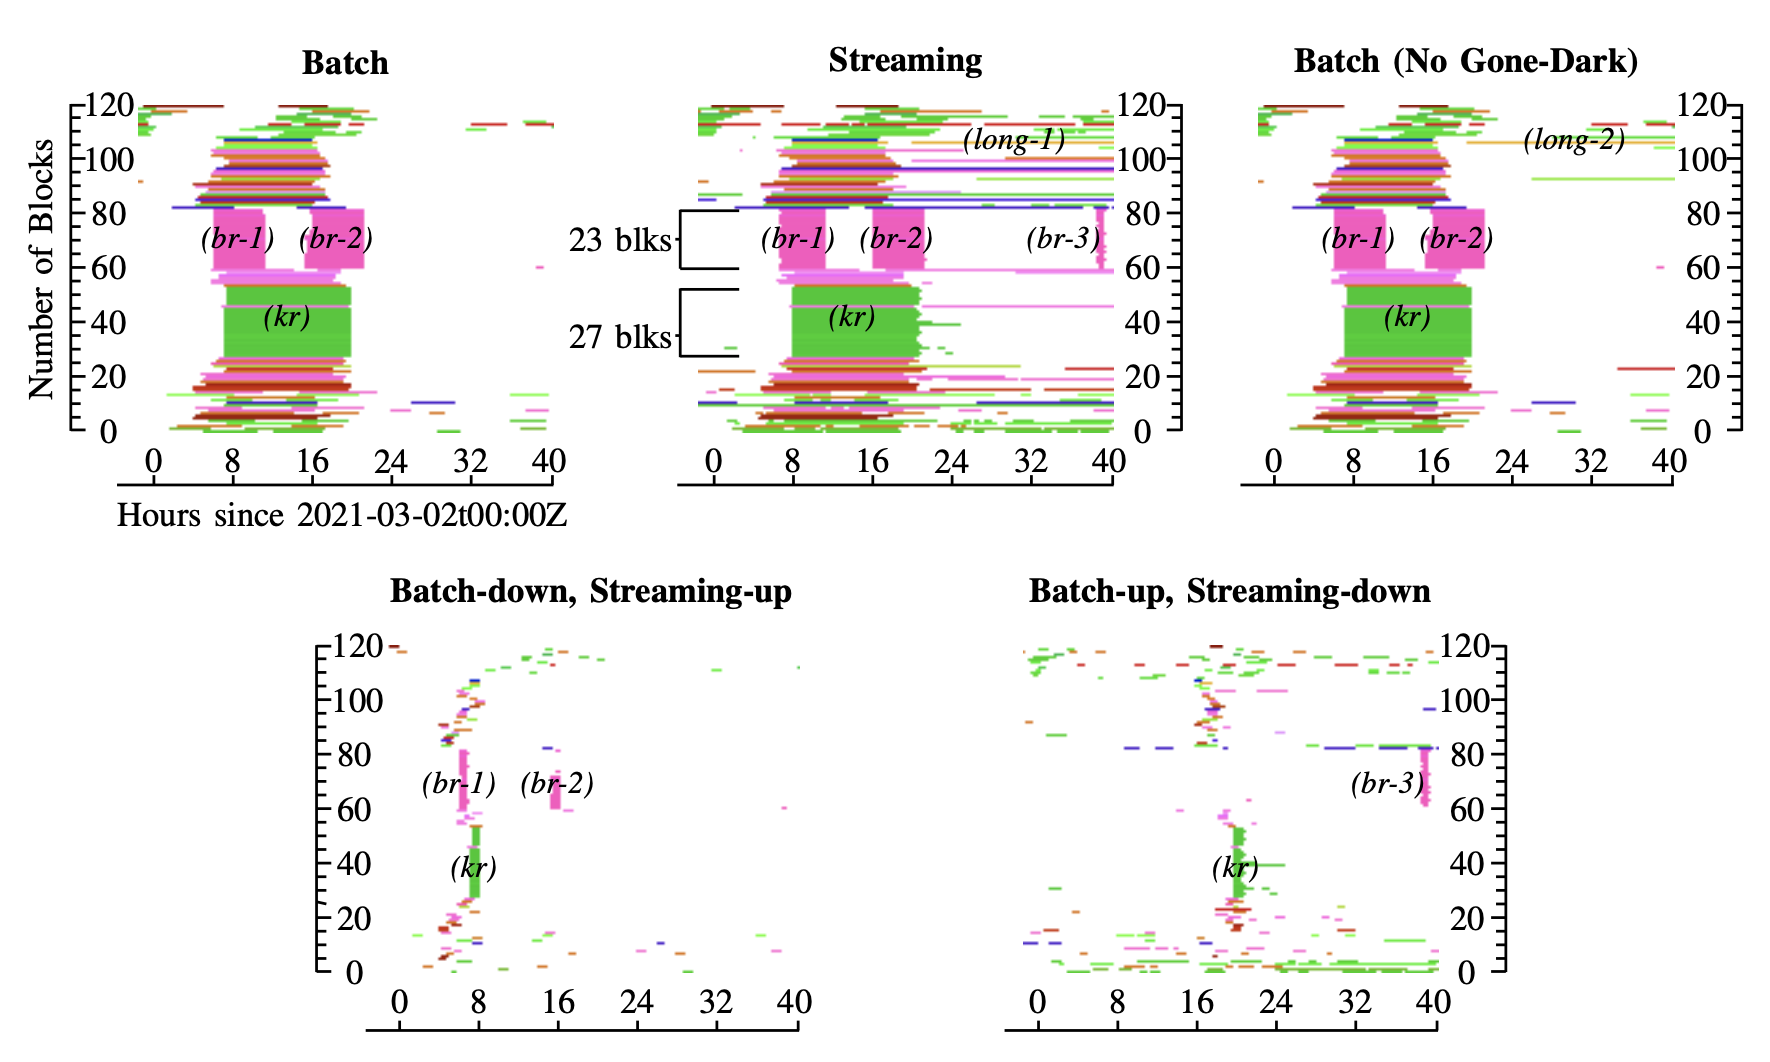
The paper “Quantifying Differences Between Batch and Streaming Detection of Internet Outages” will appear in the 2025 Conference on Network Traffic Measurement and Analysis (TMA) June 10-13, 2025 in Copenhagen, Denmark. The batch and streaming datasets are available for download.
Visual representation of outages from 2021-03-01T22:00Z to 2021-03-03T20:00Z from batch and streaming datasets (Figure 3 from [Stutz23a])
From the paper’s abstract:
A number of different systems today detect outages in the IPv4 Internet, often using active probing and algorithms based on Trinocular’s Bayesian inference. Outage detection methods have evolved, both to provide results in near-real-time, and adding algorithms to account for important but less common cases that might otherwise be misinterpreted. We compare two implementations of active outage detection to see how choices to optimize for near-real-time results with streaming compare to designs that use long-term information to maximize accuracy using batch processing. Examining 8 days of data, starting on 2021-02-26, we show that the two similar systems agree most of the time, more than 84%. We show that only 0.2% of the time the algorithms disagree, and 15% of the time only one reports. We show these differences occur due to streaming’s requirement for rapid decisions, precluding algorithms that consider long-term data (days or weeks). These results are important to understand the trade-offs that occur when balancing timely results with accuracy. Beyond the two systems we compare, our results suggest the role that algorithmic differences can have in similar but different systems, such as the several implementations of Trinocular-like active probing today.
This work is partially supported by the project “CNS Core: Small: Event Identification and Evaluation of Internet Outages (EIEIO)” (CNS-2007106) through the U.S. National Science Foundation, and by an REU supplement to that project. Erica Stutz began this work at Swarthmore College, working remotely for the University of Southern California; her current affiliation is Yale University.
Today around 3:30pm local time (around 2025-02-25 T18:30Z), Chile suffered a major power outage. News reports suggest 8 million or more are without power.
We can see the effects of this power outage on Internet access as measured by Trinocular, our internet outage detection system. Outages start around 18:30Z and increase steadily to 20:30Z, the most recent data we have.
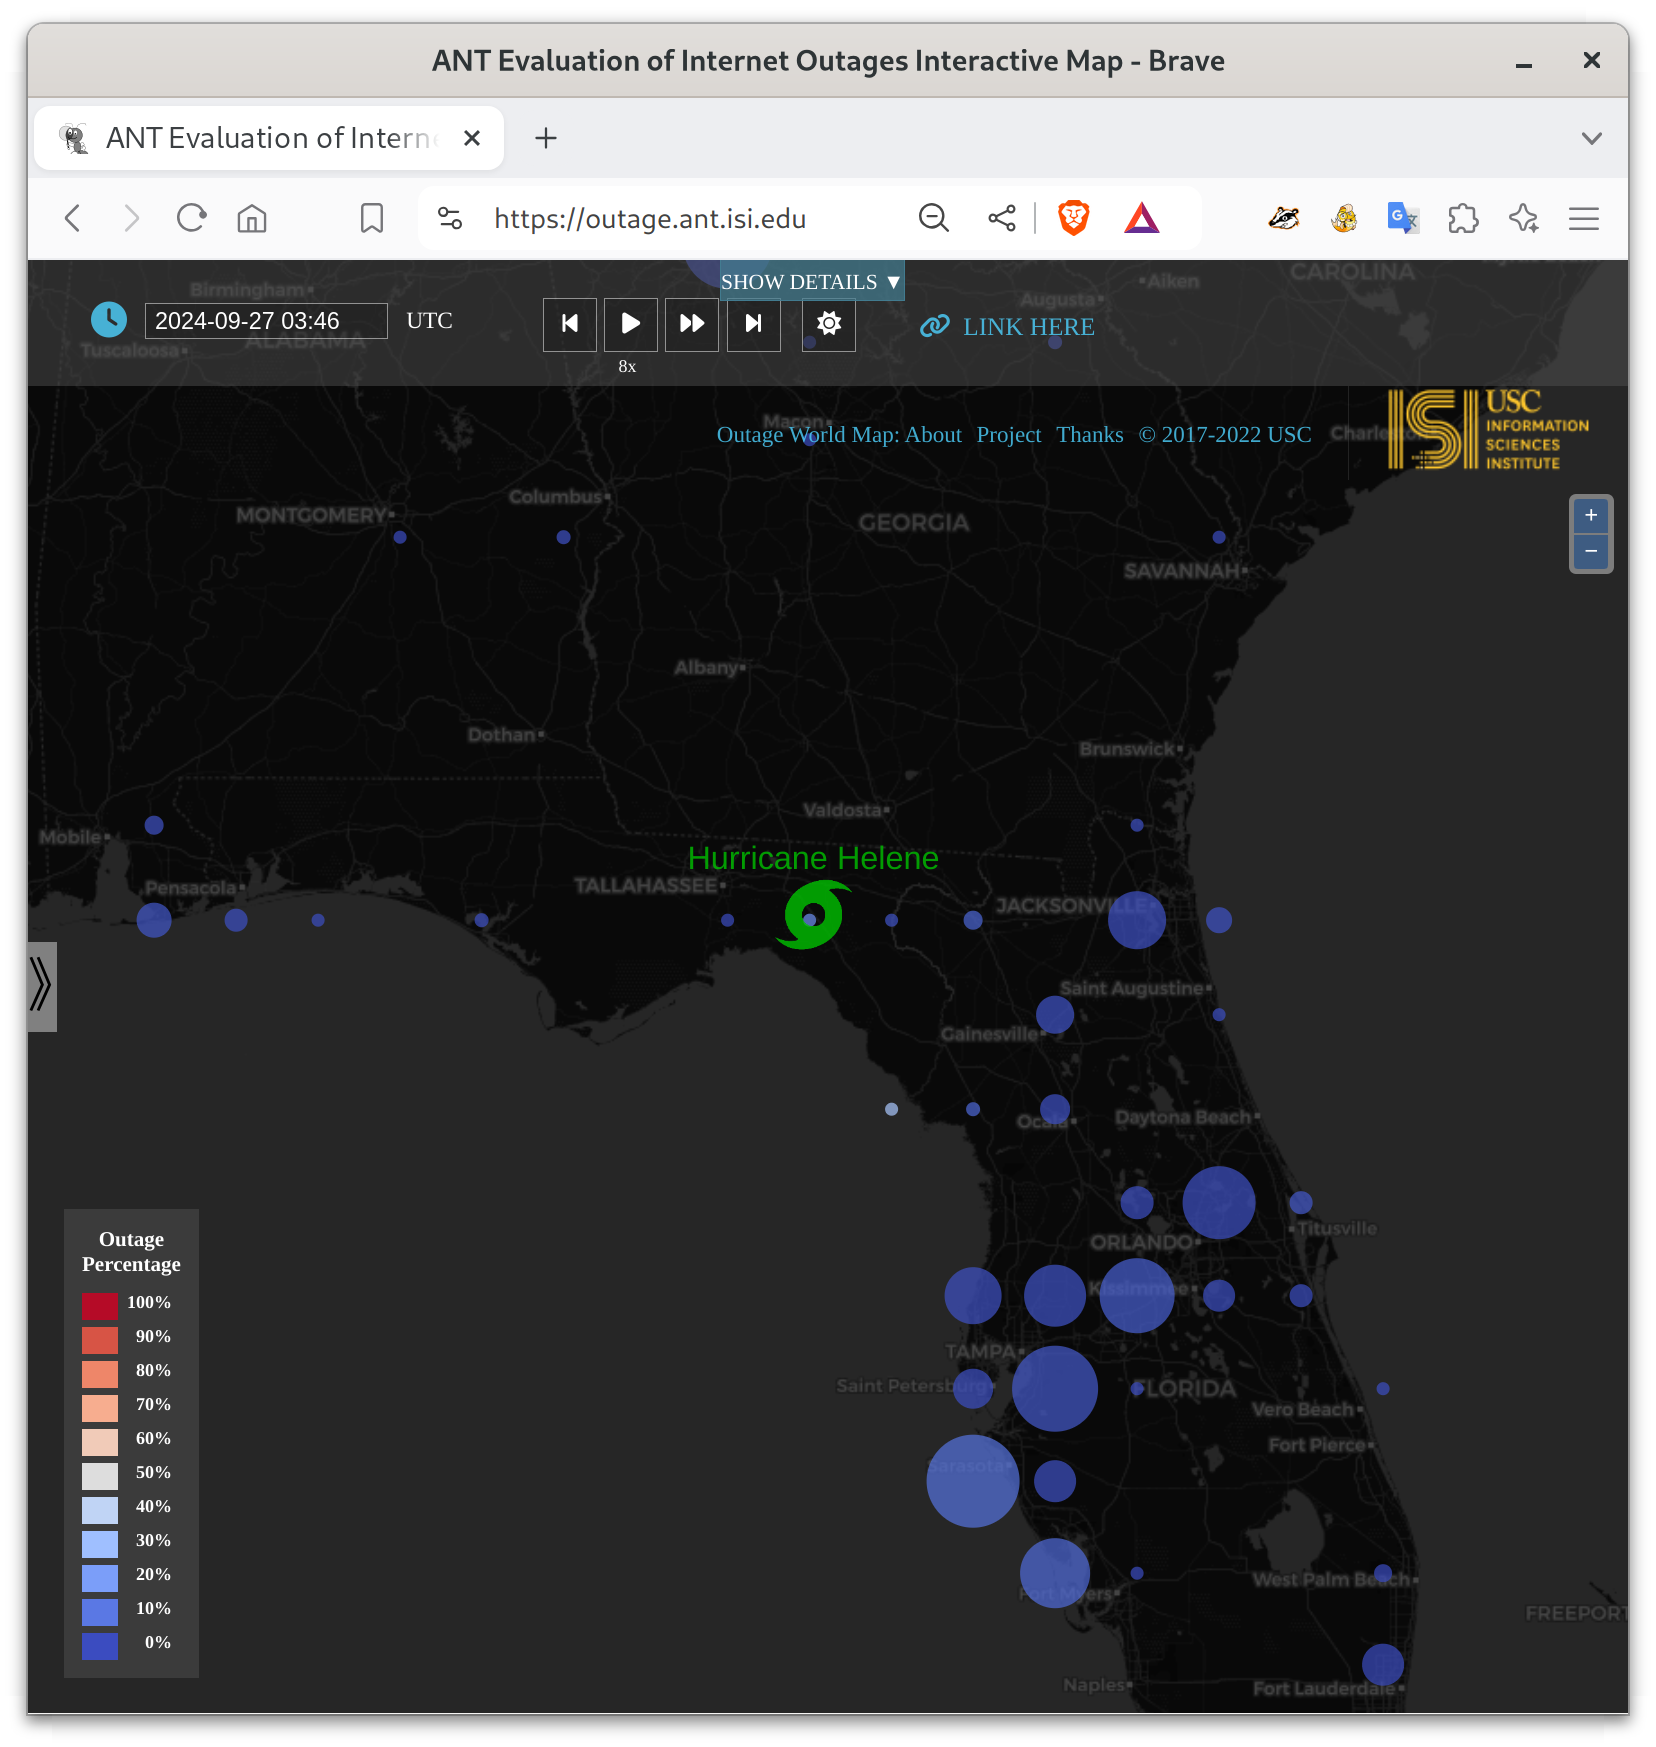
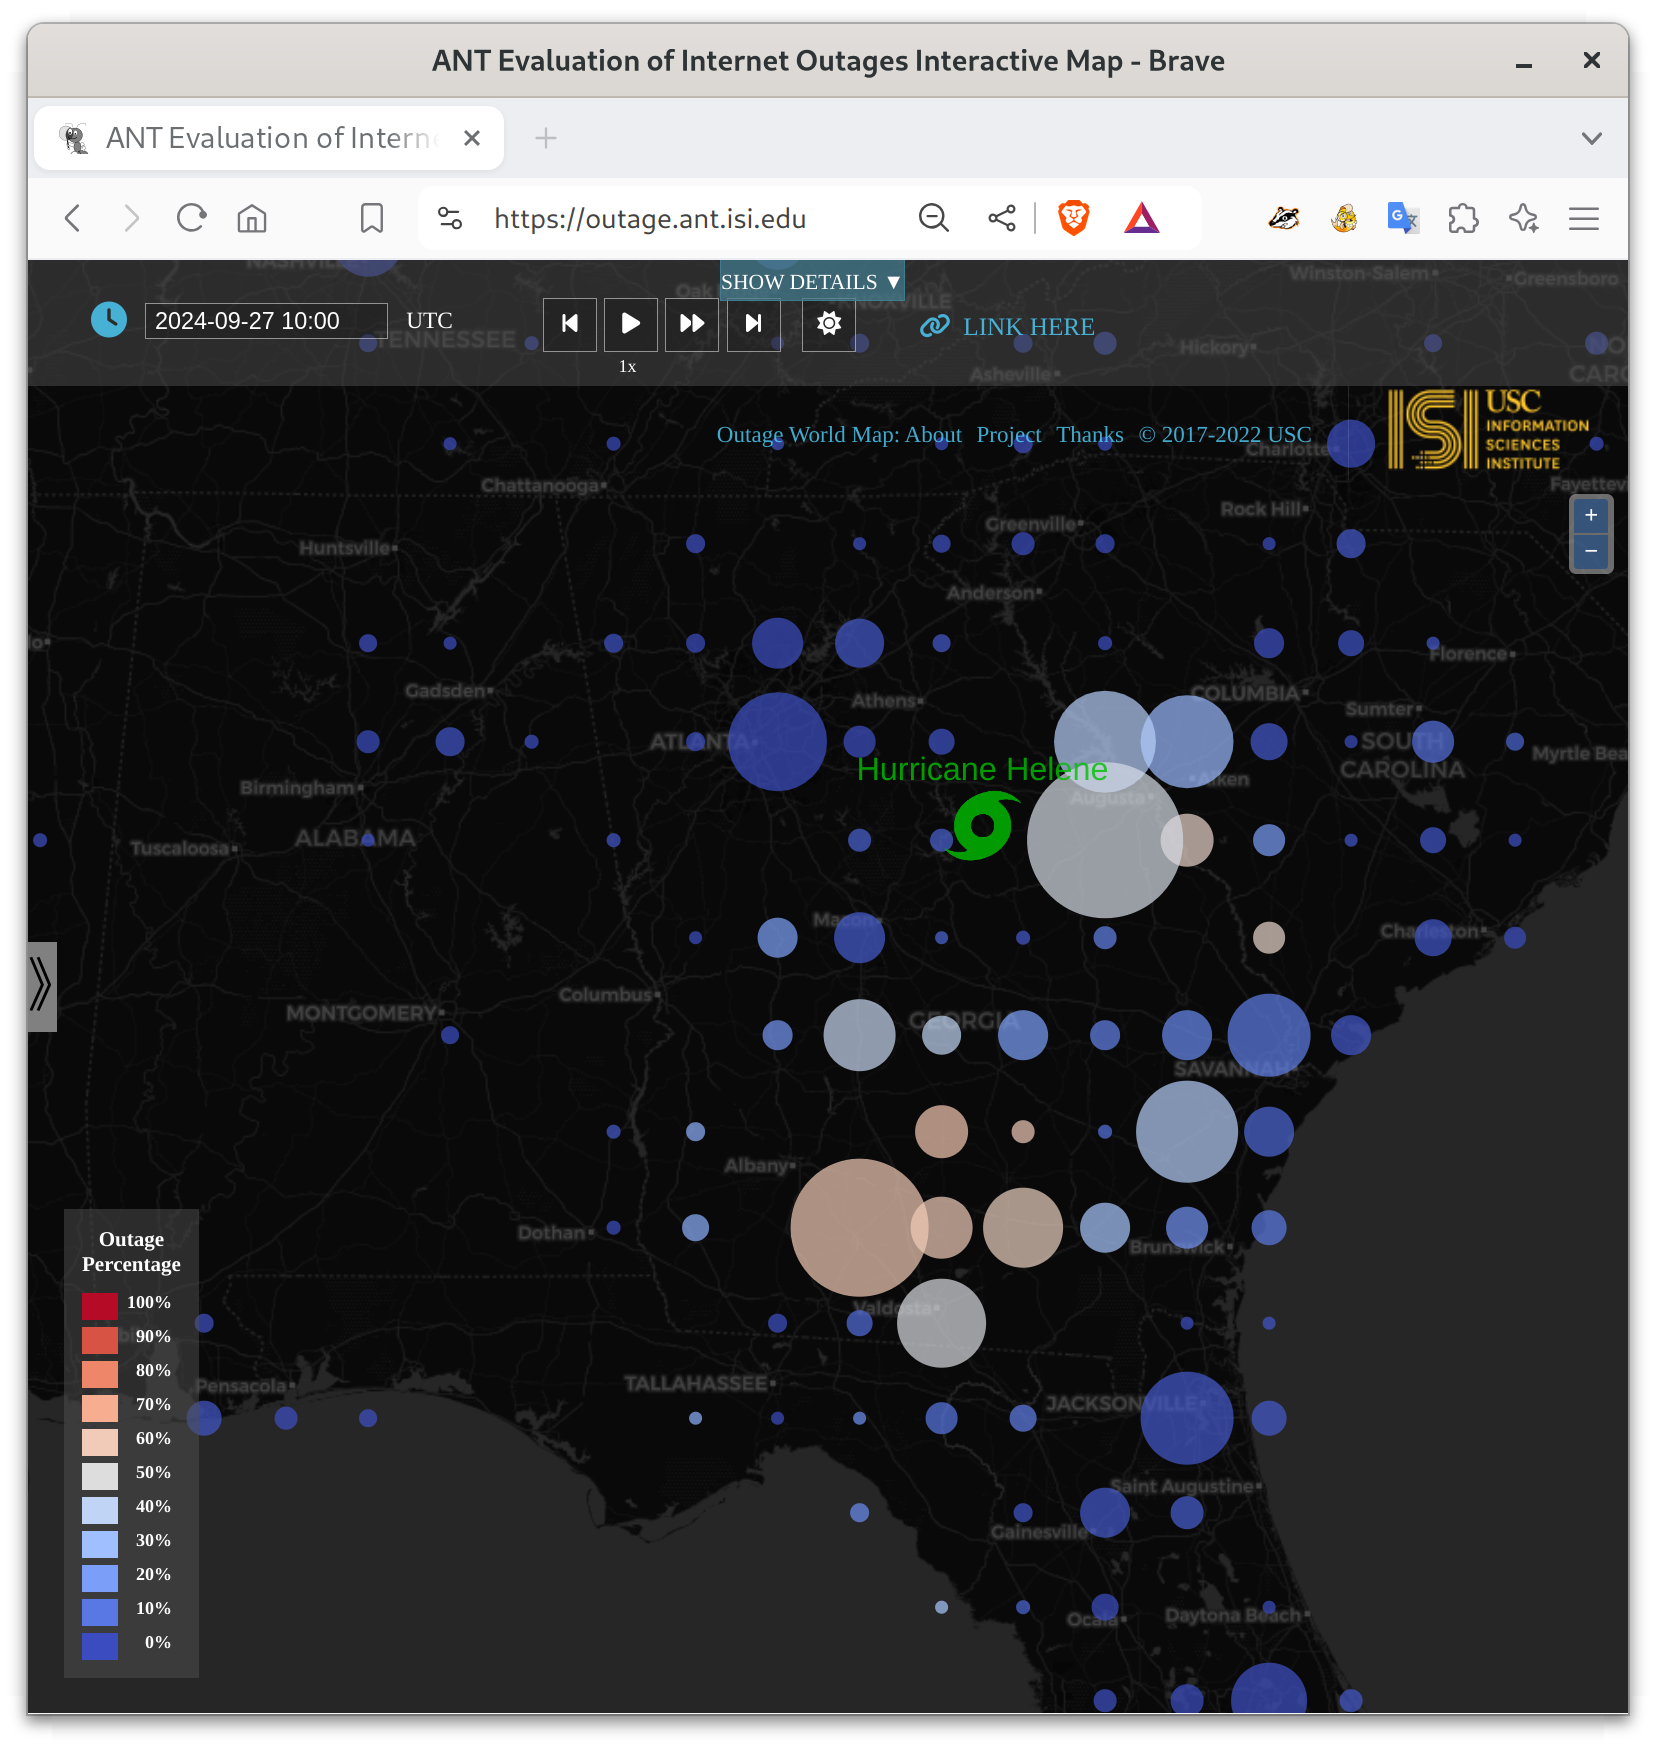
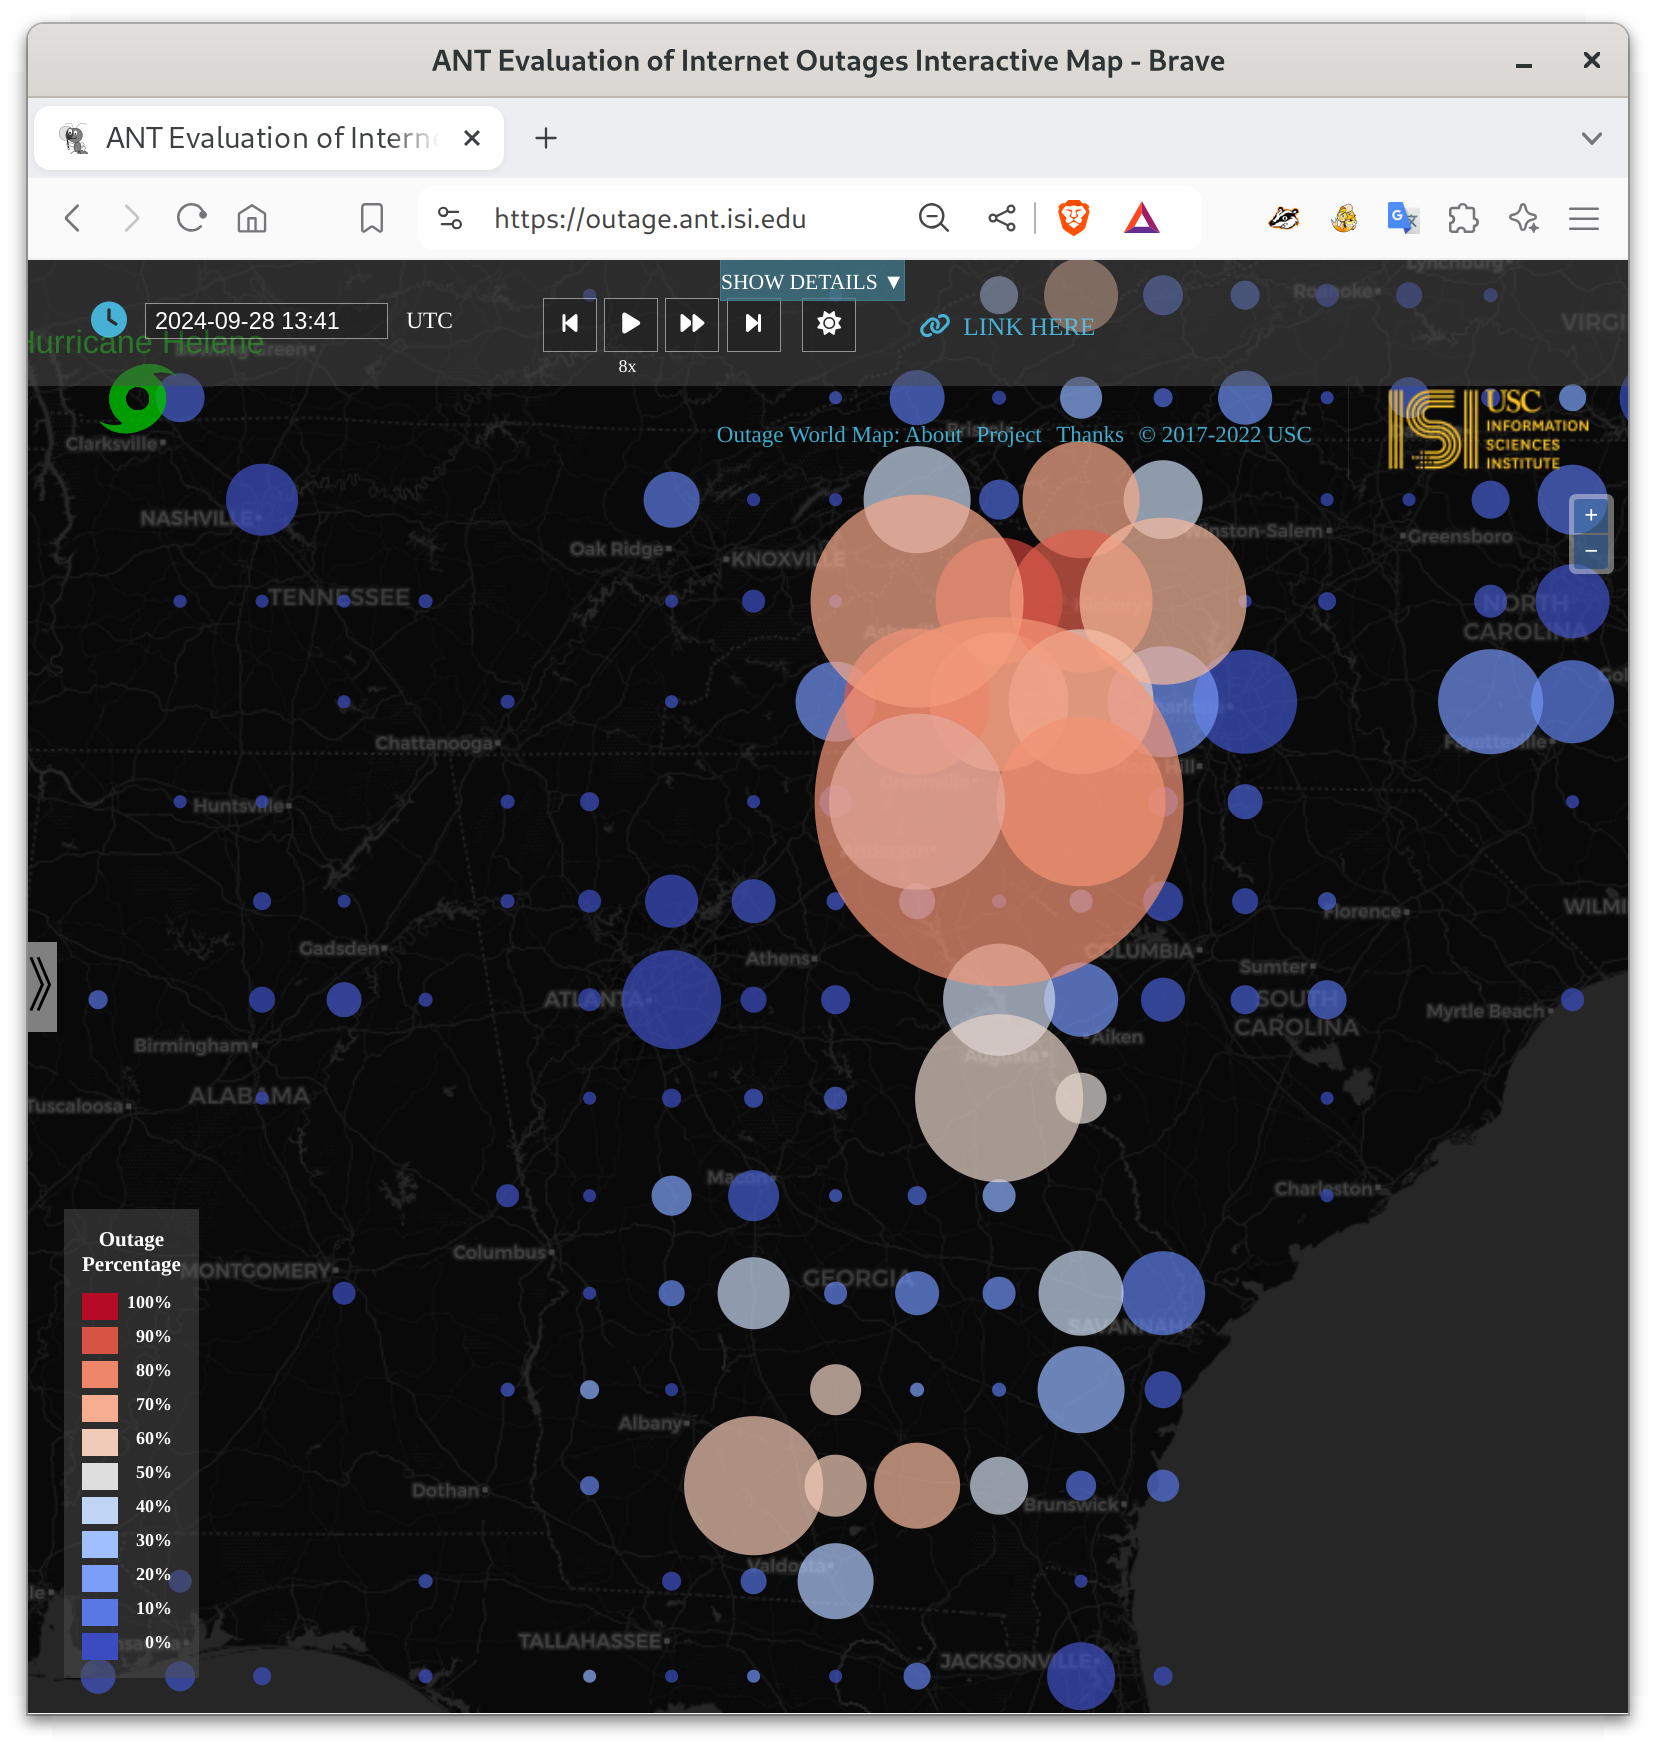
Hurricane Helene made landfall in the U.S. at 11:10pm EDT Sept. 26 (2024-09-27t03:10Z) near Tallahassee, Florida, and we’ve been watching it in the Trinocular Internet Outage system.
Flordia Internet infrasructure appears to have done quite well, with relatively few Internet outages. Here is the view 4.5 hours after landfall, at 3:40am EDT Sept. 27 (2024-09-27t07:40Z), when the eye was already over southern Georgia:
However, storm damange resulted in many outages across Georgia at daybreak. Here is 11 hours after landfall, at 6am EDT Sept 27 (2024-09-27t10:00):
Fortunately the Internet infrastructure in Georgia was quick to recover, suggesting most Internet outages were power loss. We wish the best for those in Kentucky, and for those with physical storm damage and coping with flooding.
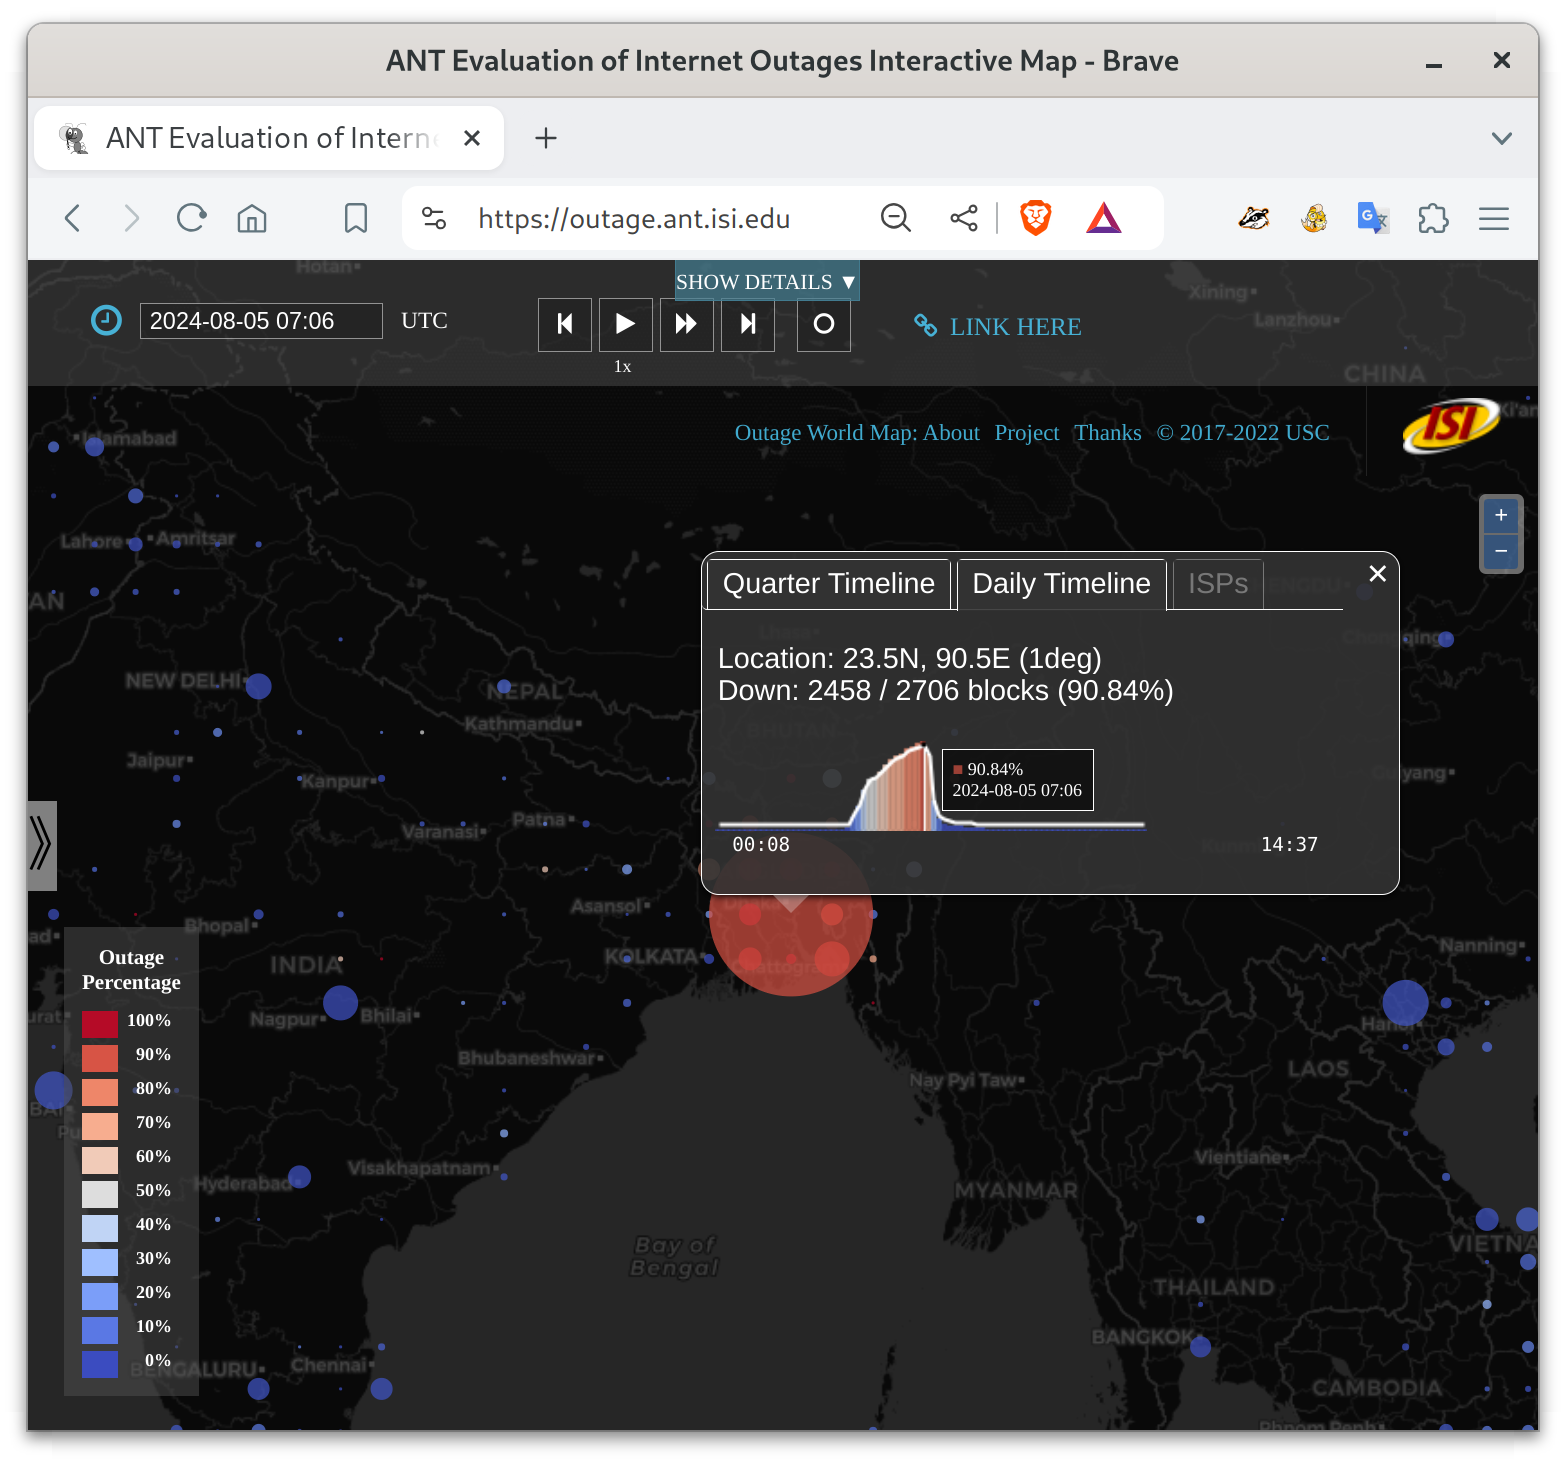
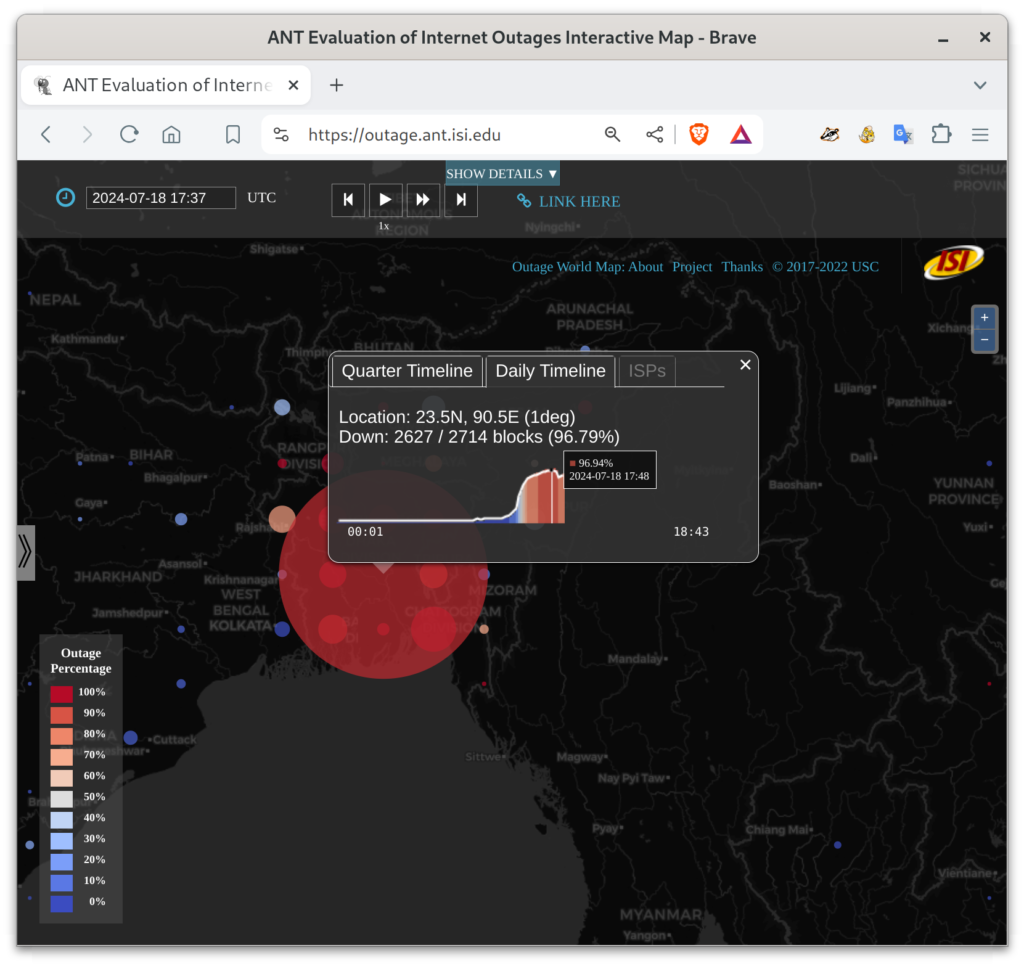
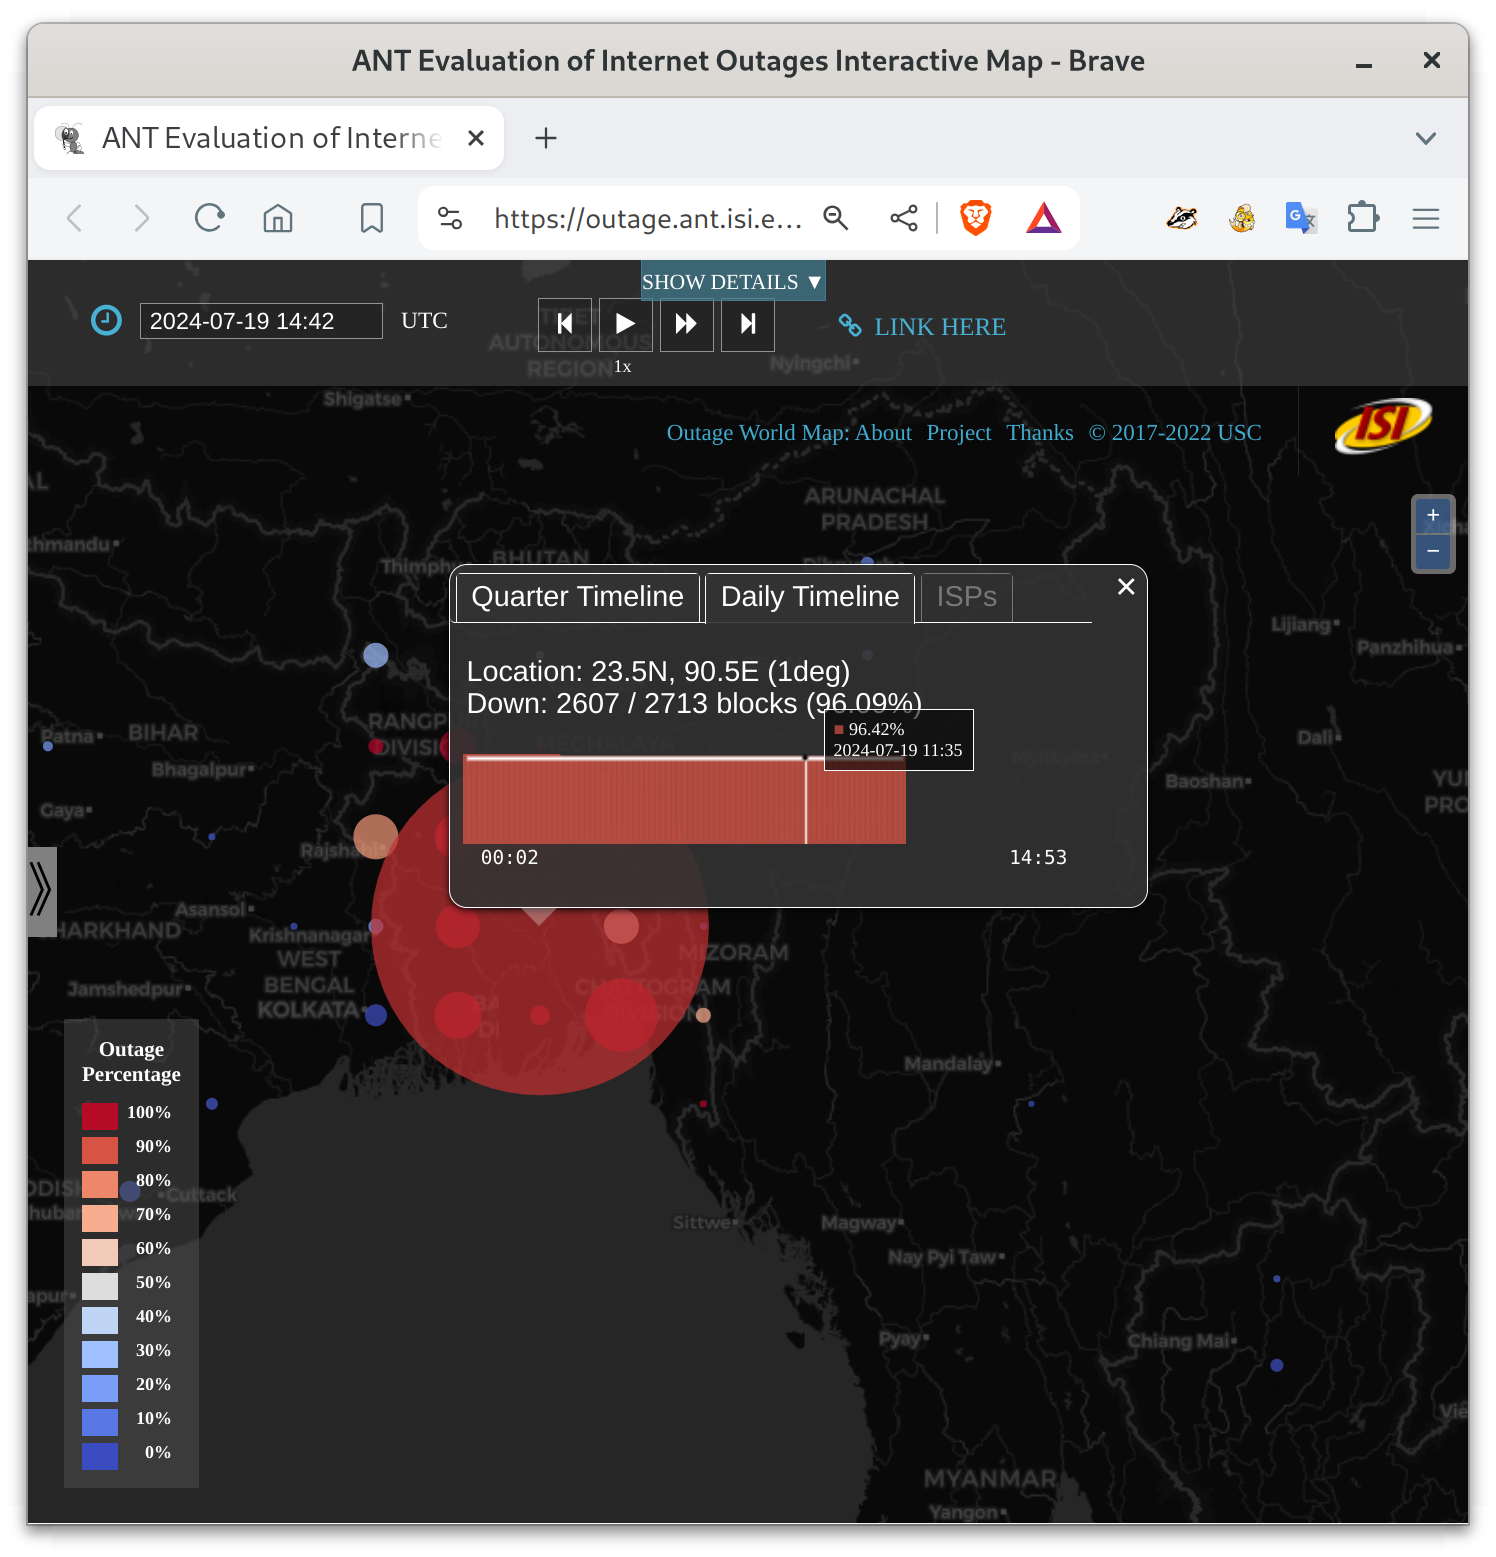
The AP reports “A statement from the country’s Telecommunication Regulatory Commission said they were unable to ensure service after their data center was attacked Thursday by demonstrators, who set fire to some equipment. The Associated Press was not able to independently verify this.” However, the near-complete outage observed by Trinocular (as seen in the figures above) seems inconsistent with problems at a single datacenter.
Update July 19, 22:28Z:ISOC Pulse has a post about this outage, and reports that “In a press event on 18 July, Bangladesh minister for posts, telecommunications, and information technology, Zunaid Ahmed Palak confirmed that the government had ordered the shutdown. “
To add about the root cause, the Deccan Heraldpublished an article from Reuters quoting Zunaid Ahmed Palak, junior information technology minister, as saying to reporters: “Mobile internet has been temporarily suspended due to various rumors and the unstable situation created…. on social media” on July 18. Today, Reuters quoted Palak as saying that “broadband internet would be restored by Tuesday night but [he] did not comment on mobile internet”. This statement is consistent with the country-wide outage we observed, and the prior statement suggests the outage was a request of the government.
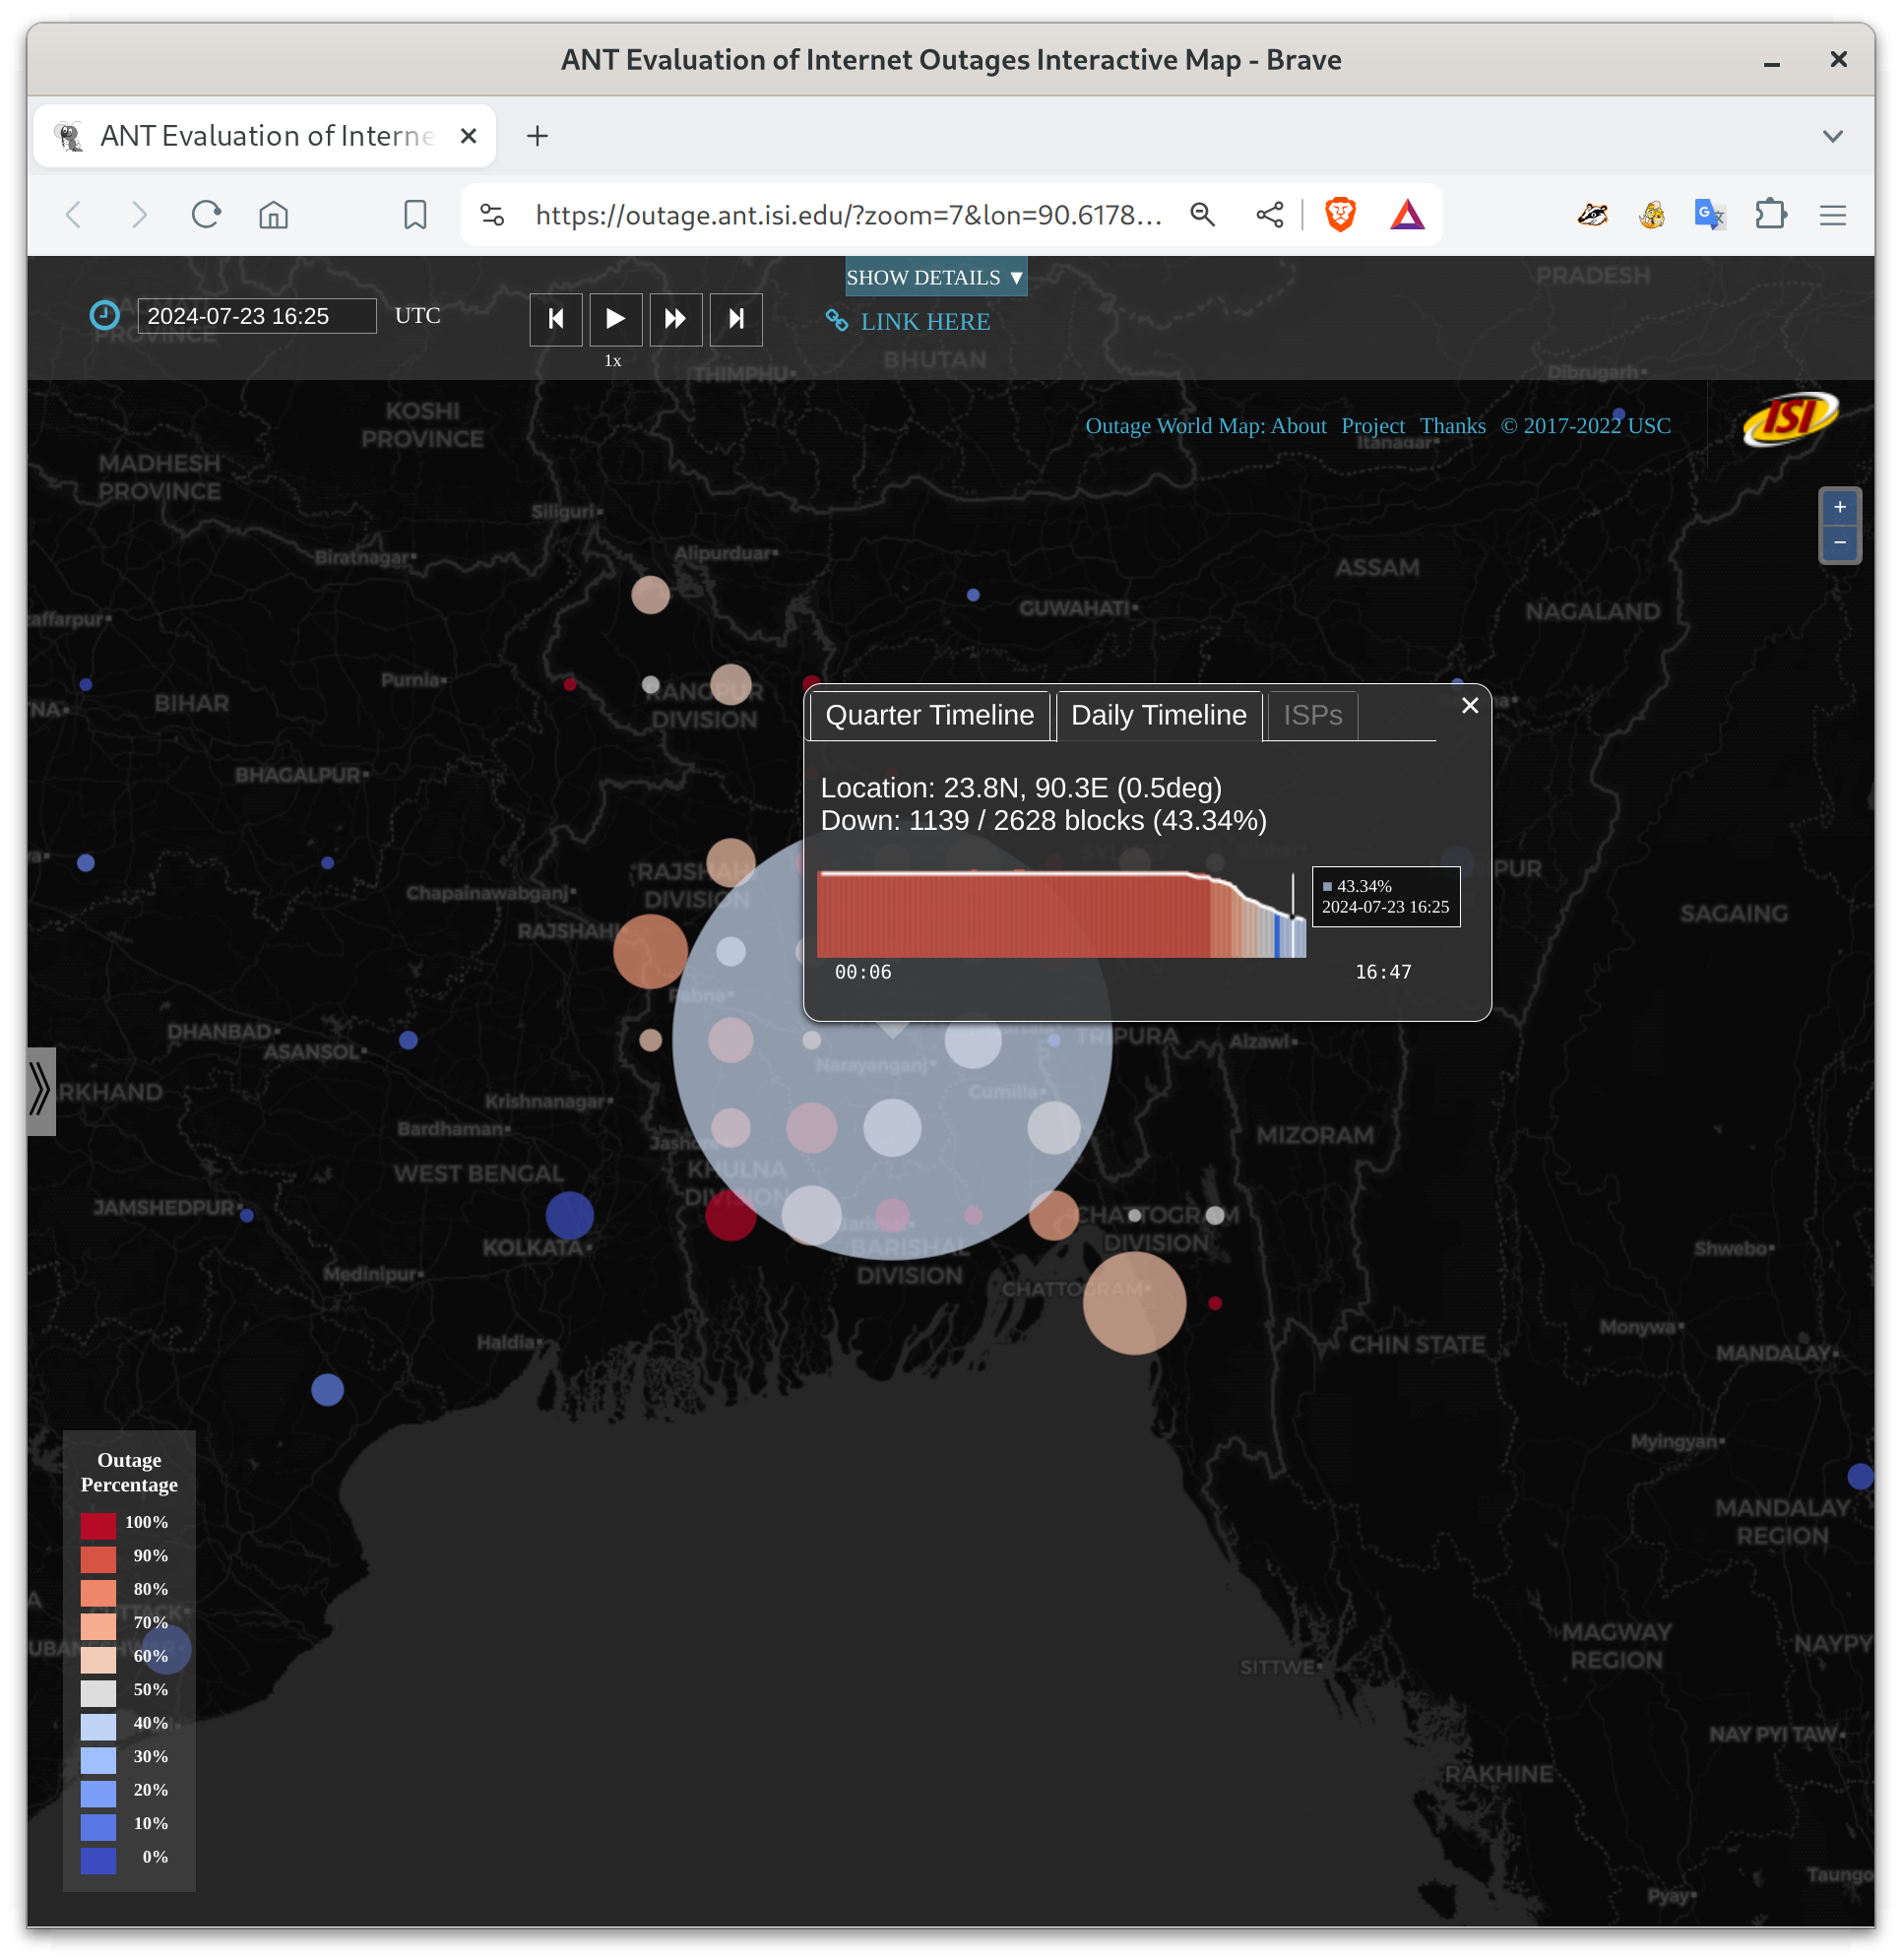
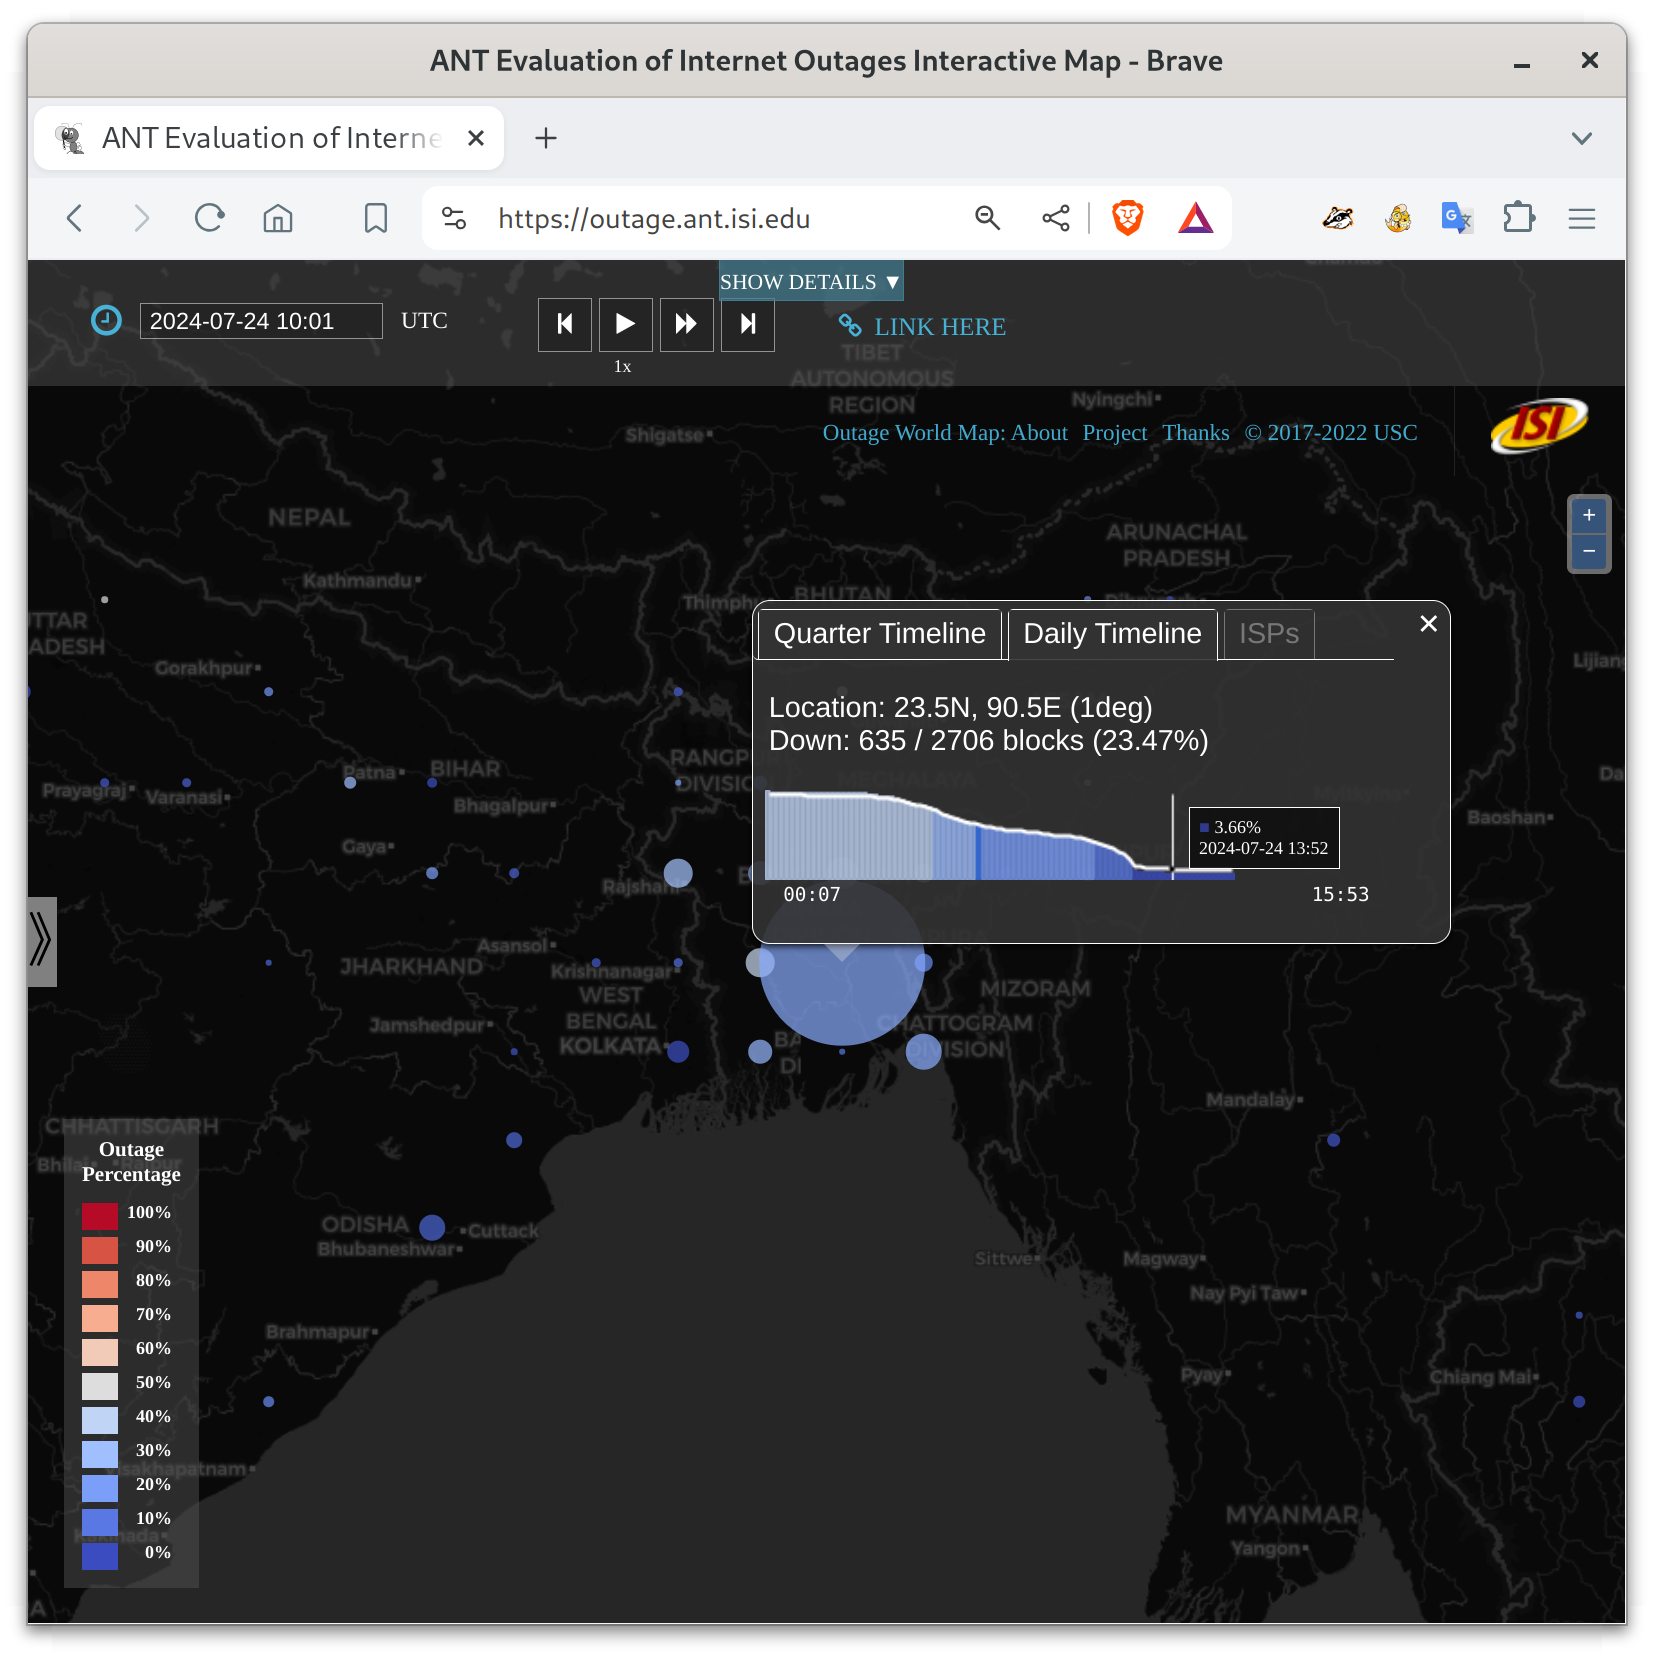
Update July 24, 13:00Z (19:00 in Bangladesh): It looks like nearly all Bangladeshi networks are now back online.
Update July 25:The July 25 episode of The Briefing, an Australian news podcast, discussed the Bangladeshi outage and its impact, interviewing us about what we saw.
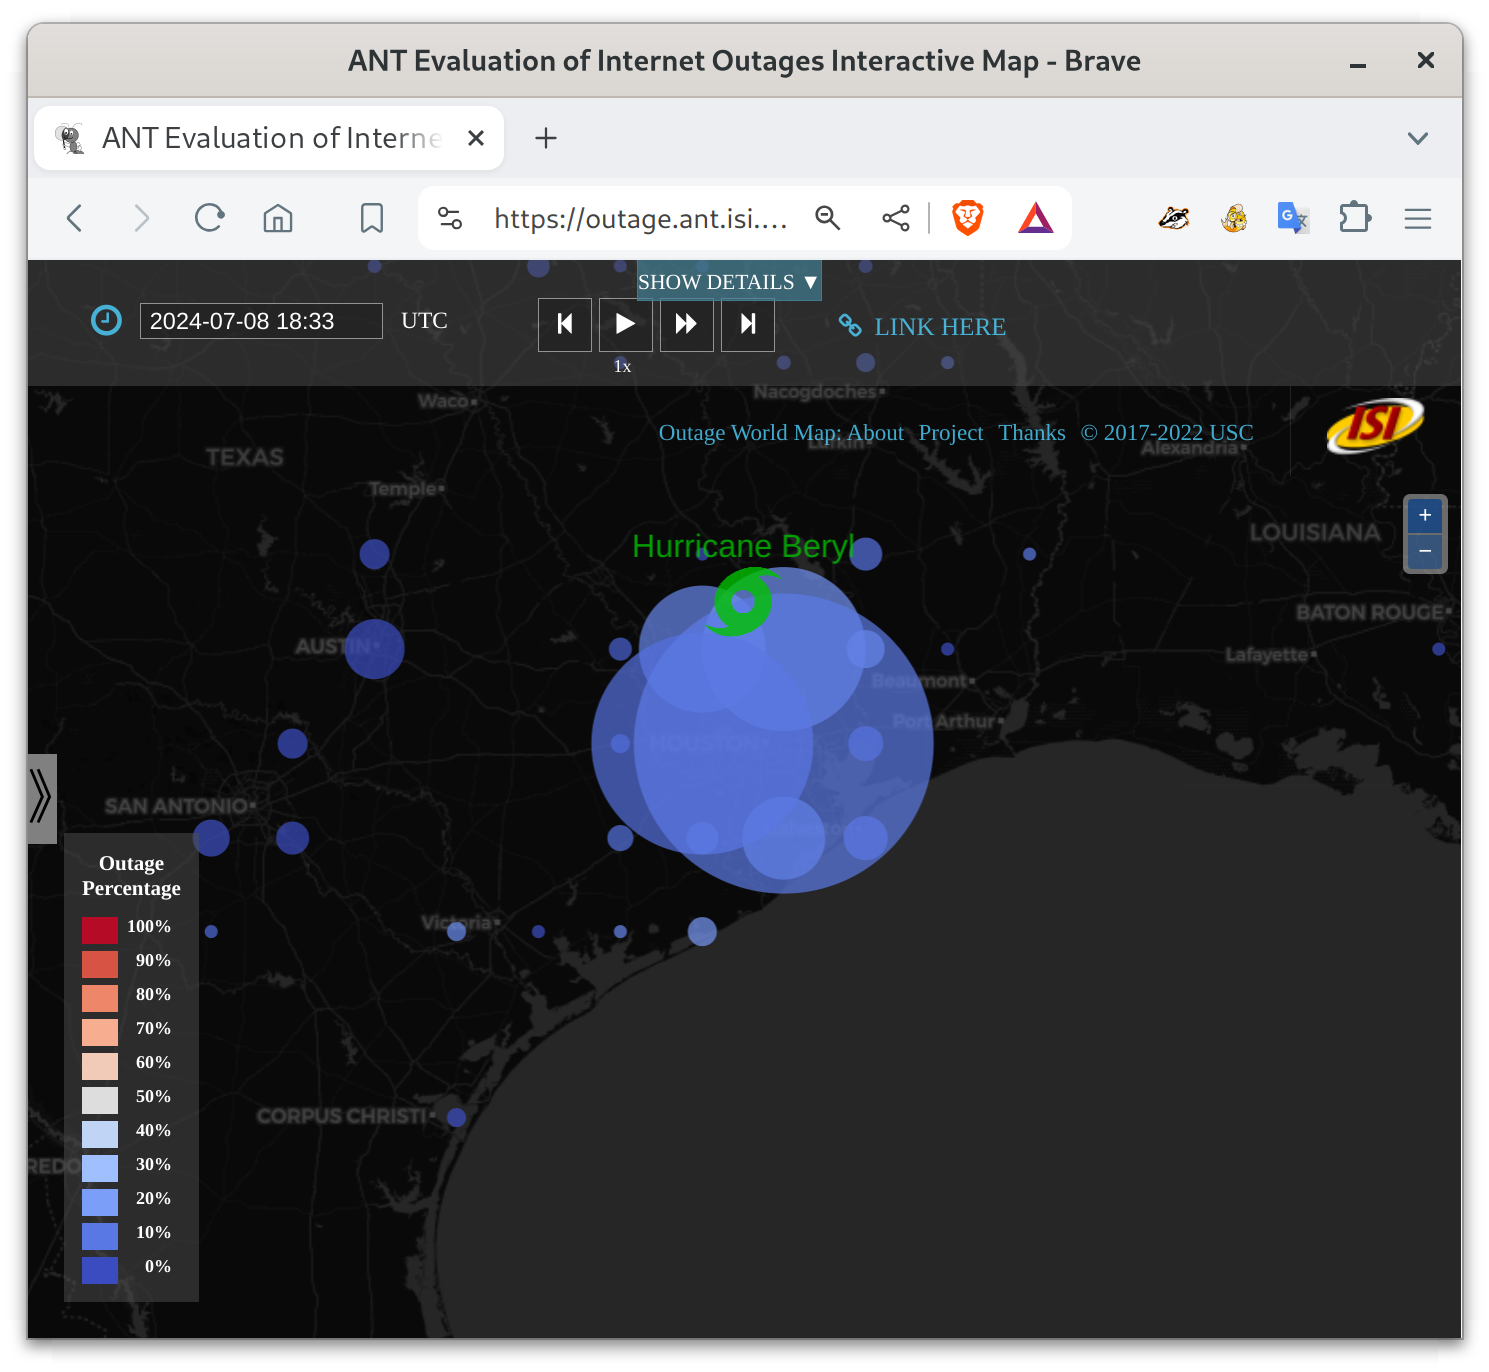
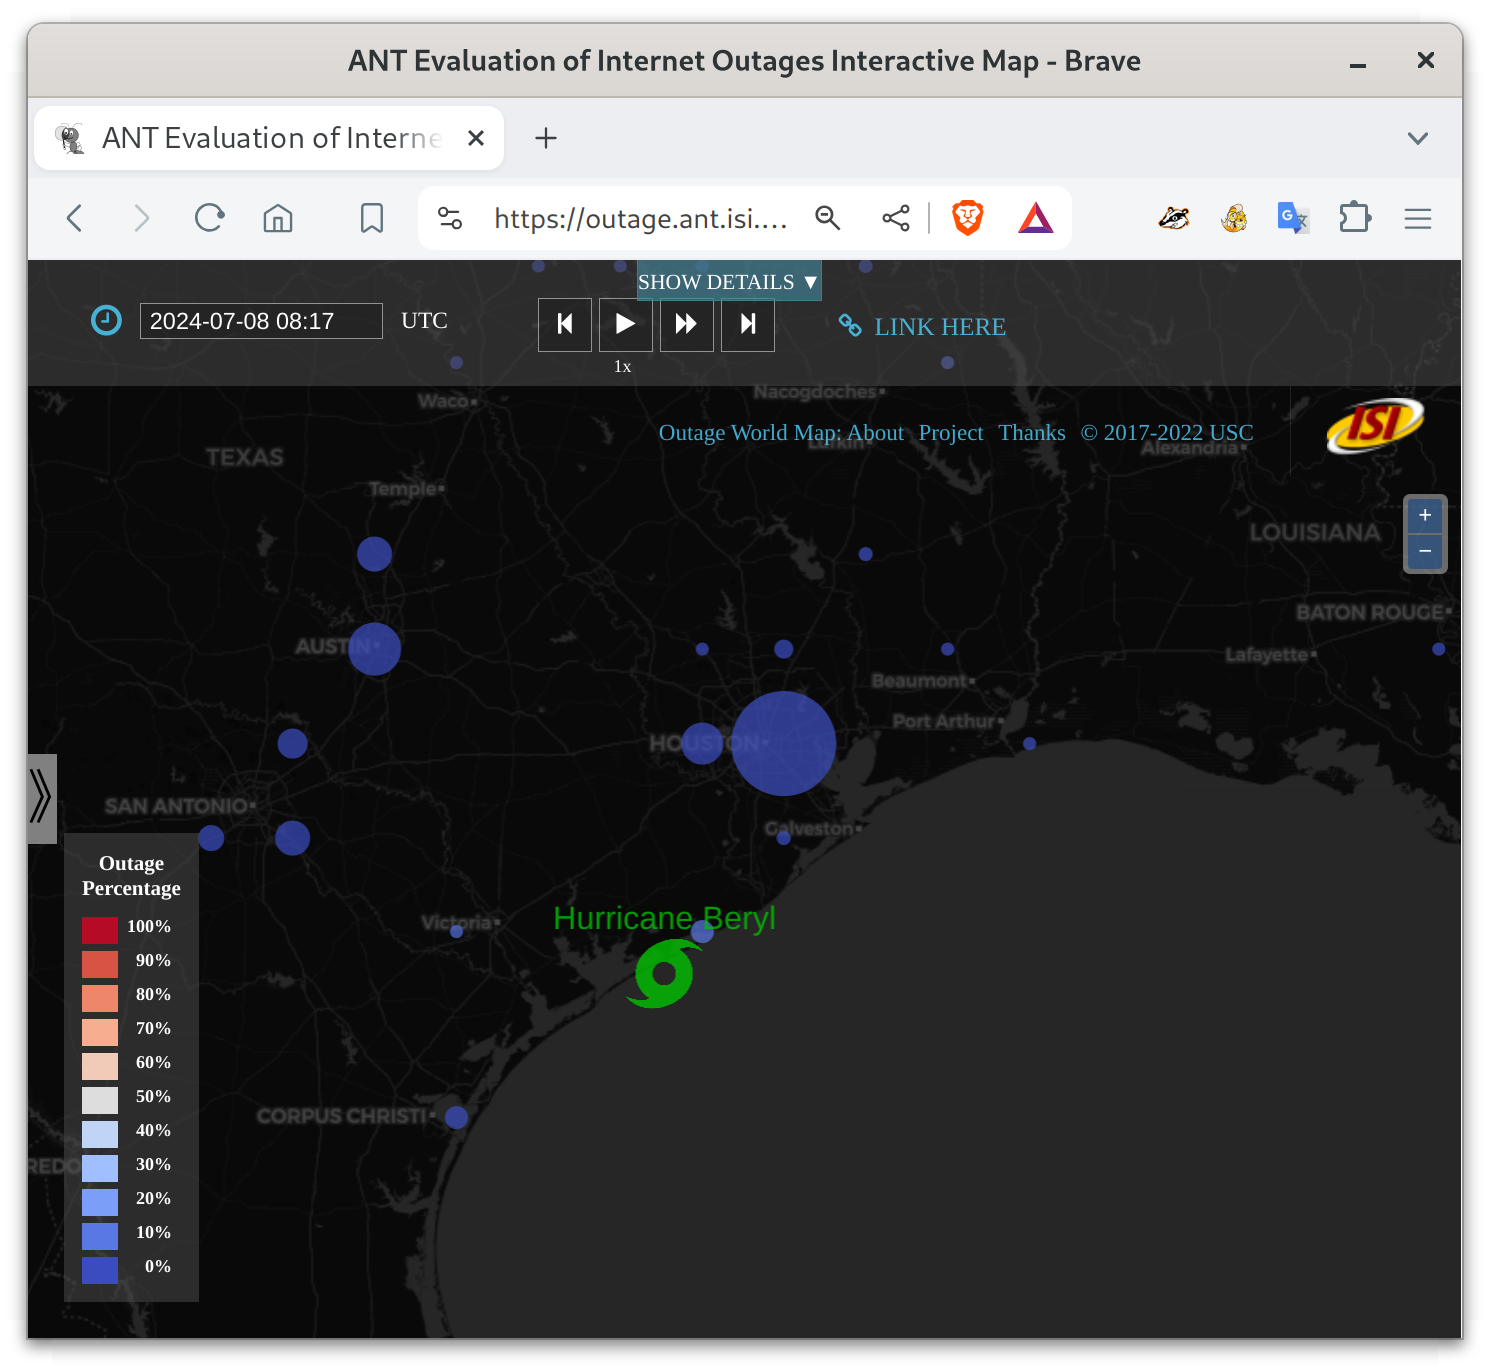
Hurricane Beryl made landfall in Texas around 2024-07-08 at 3:17am local time (CDT) (8:17 UTC). We see a fair number of Internet outages in the Huston area, presumably as people lost power due to flooding.
Compared to our view of Hurricane Harvey in 2017 in our blog and web, Beryl looks much less severe–we see fewer areas where most Internet acccess is out (as shown by red circles).
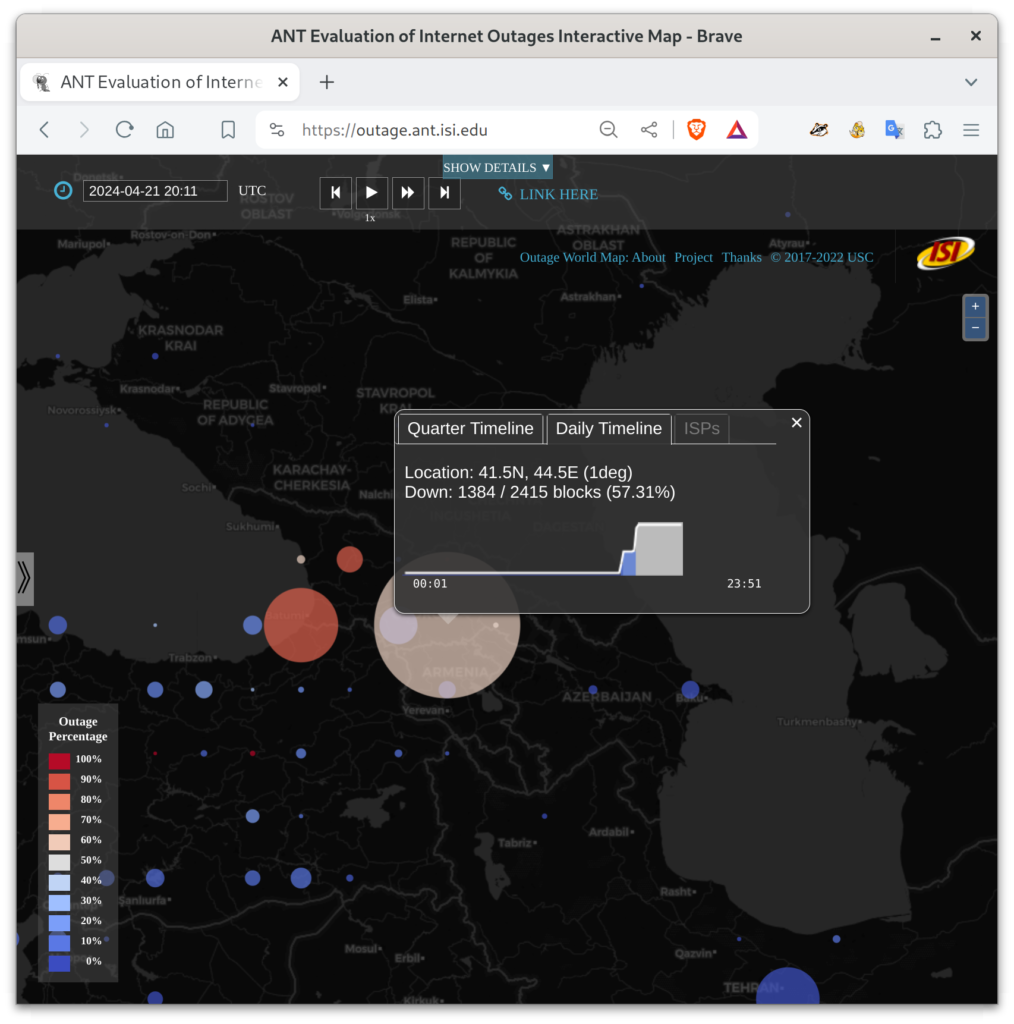
Starting on April 21, 2024, we observed a large Internet outage in the country Georgia. More than half the IP blocks in large parts of the country have become unreachable from the U.S., with the problem persisting for several days so far.
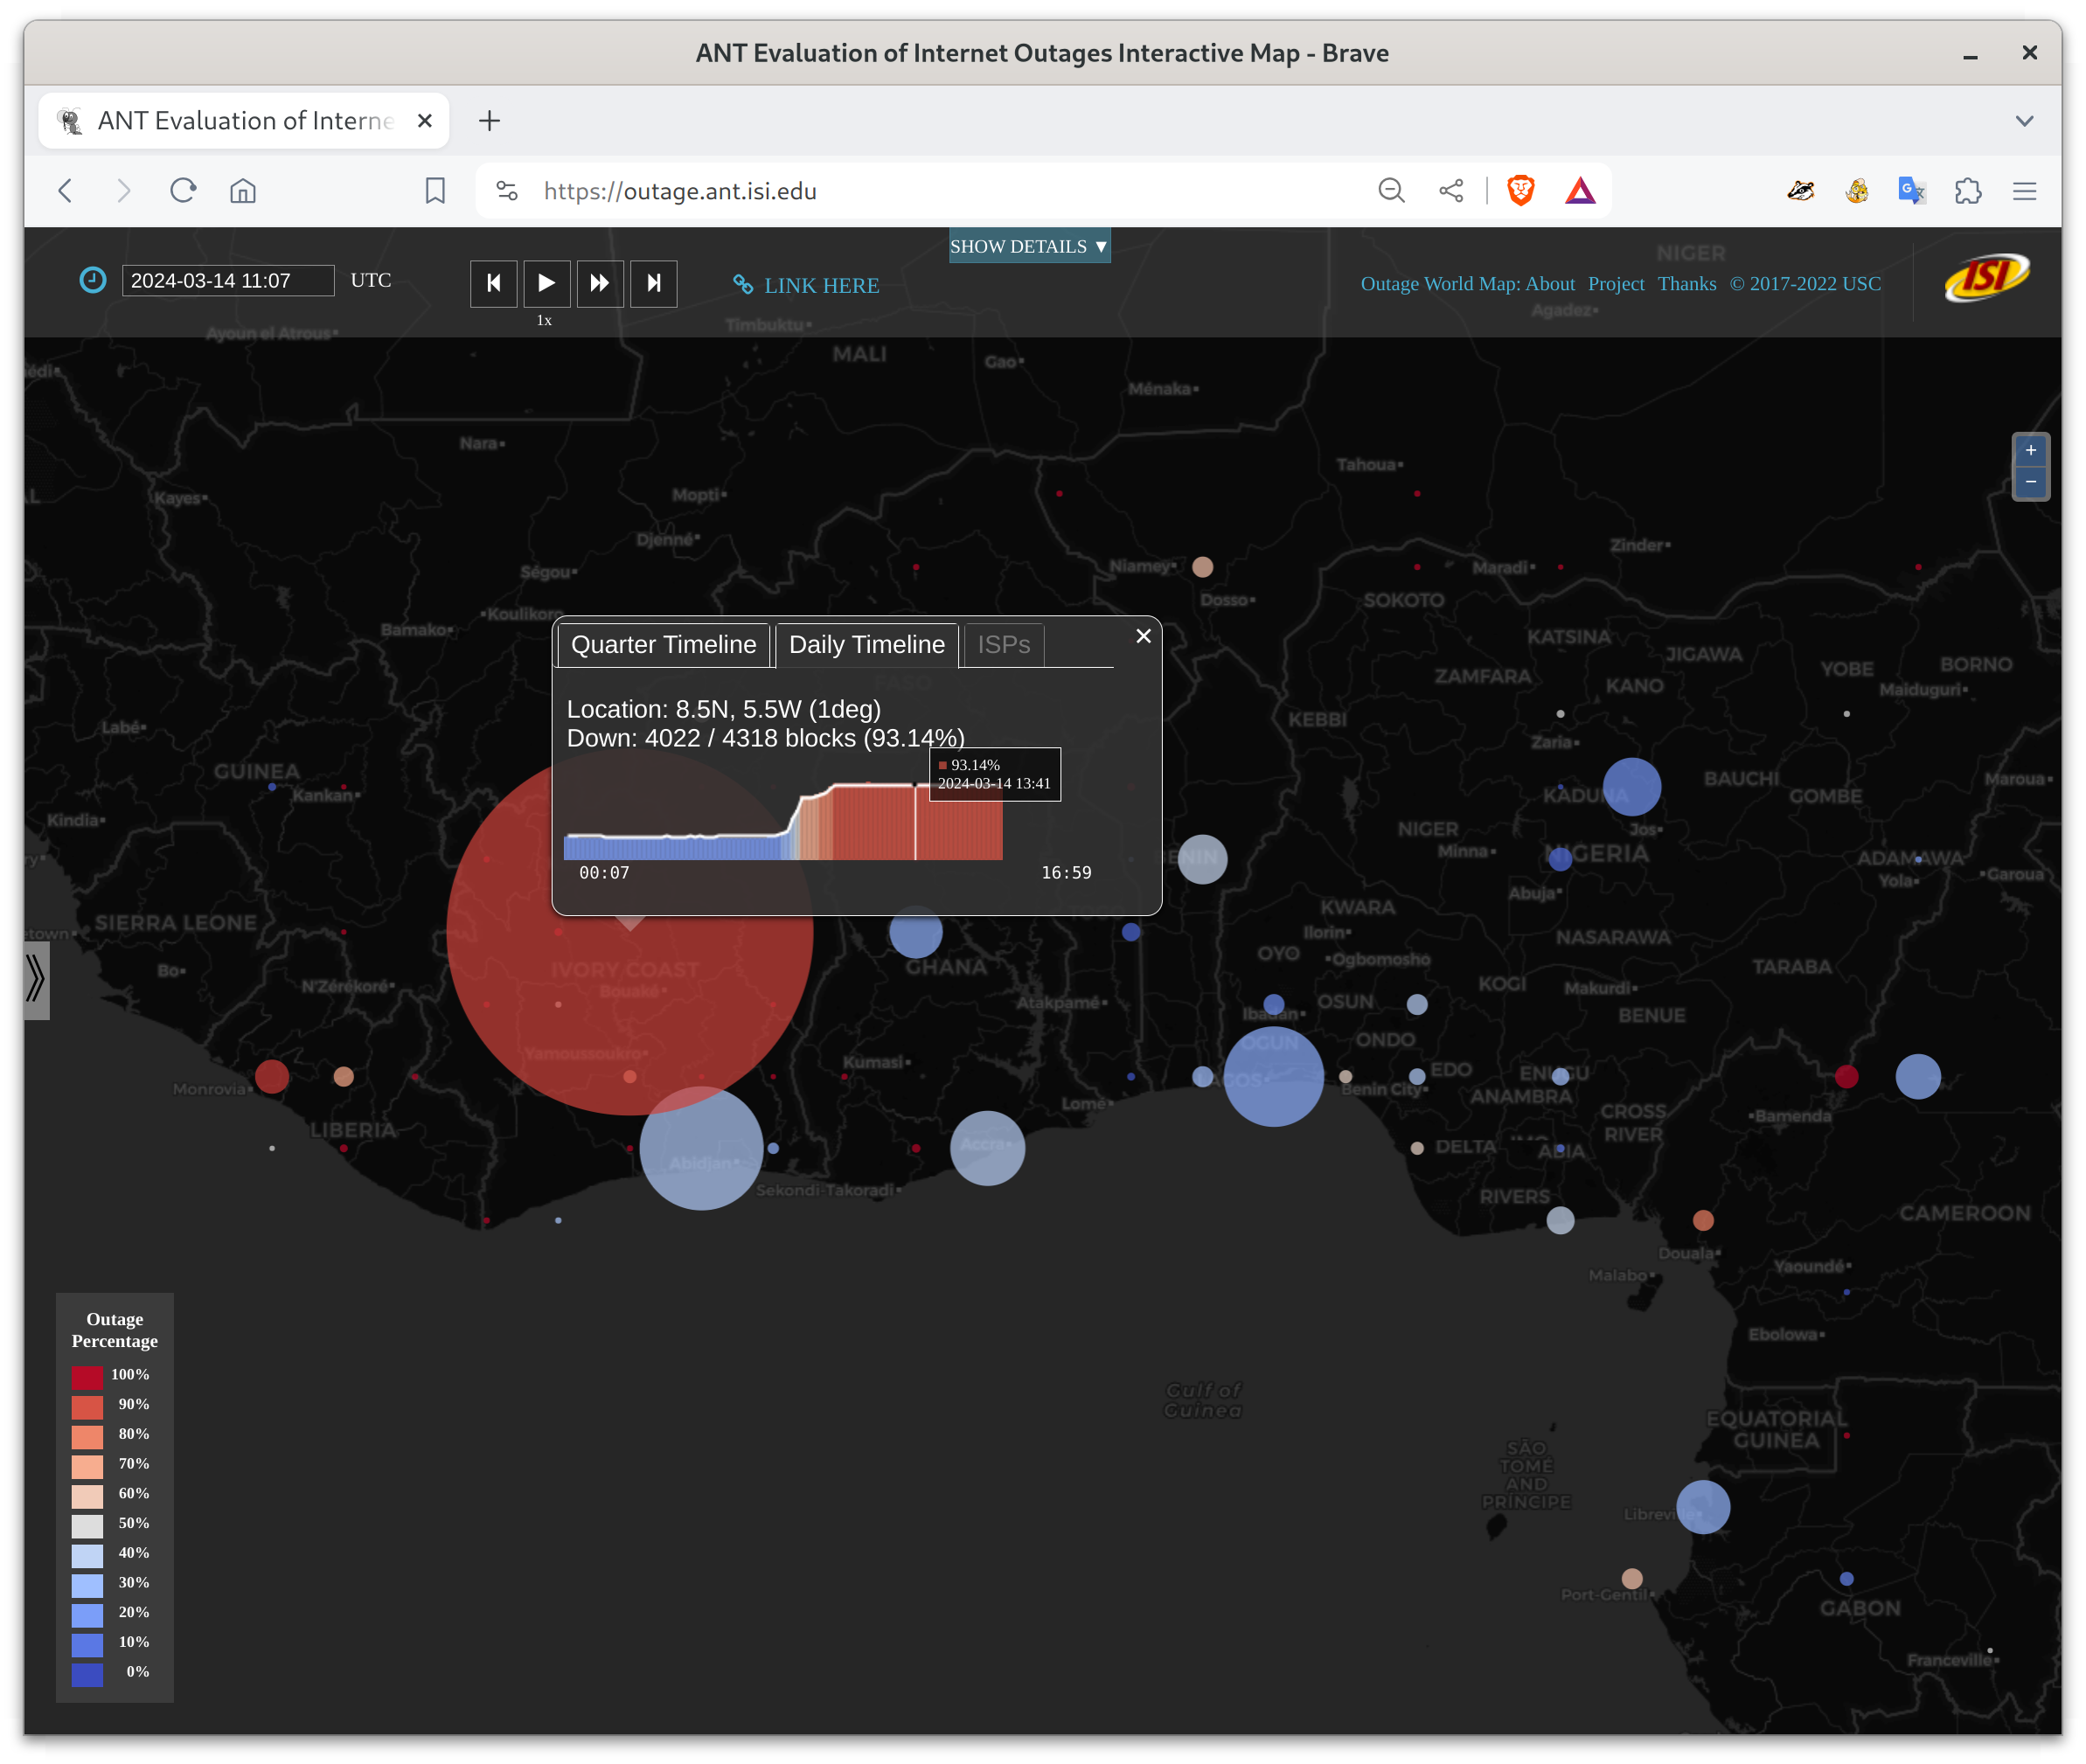
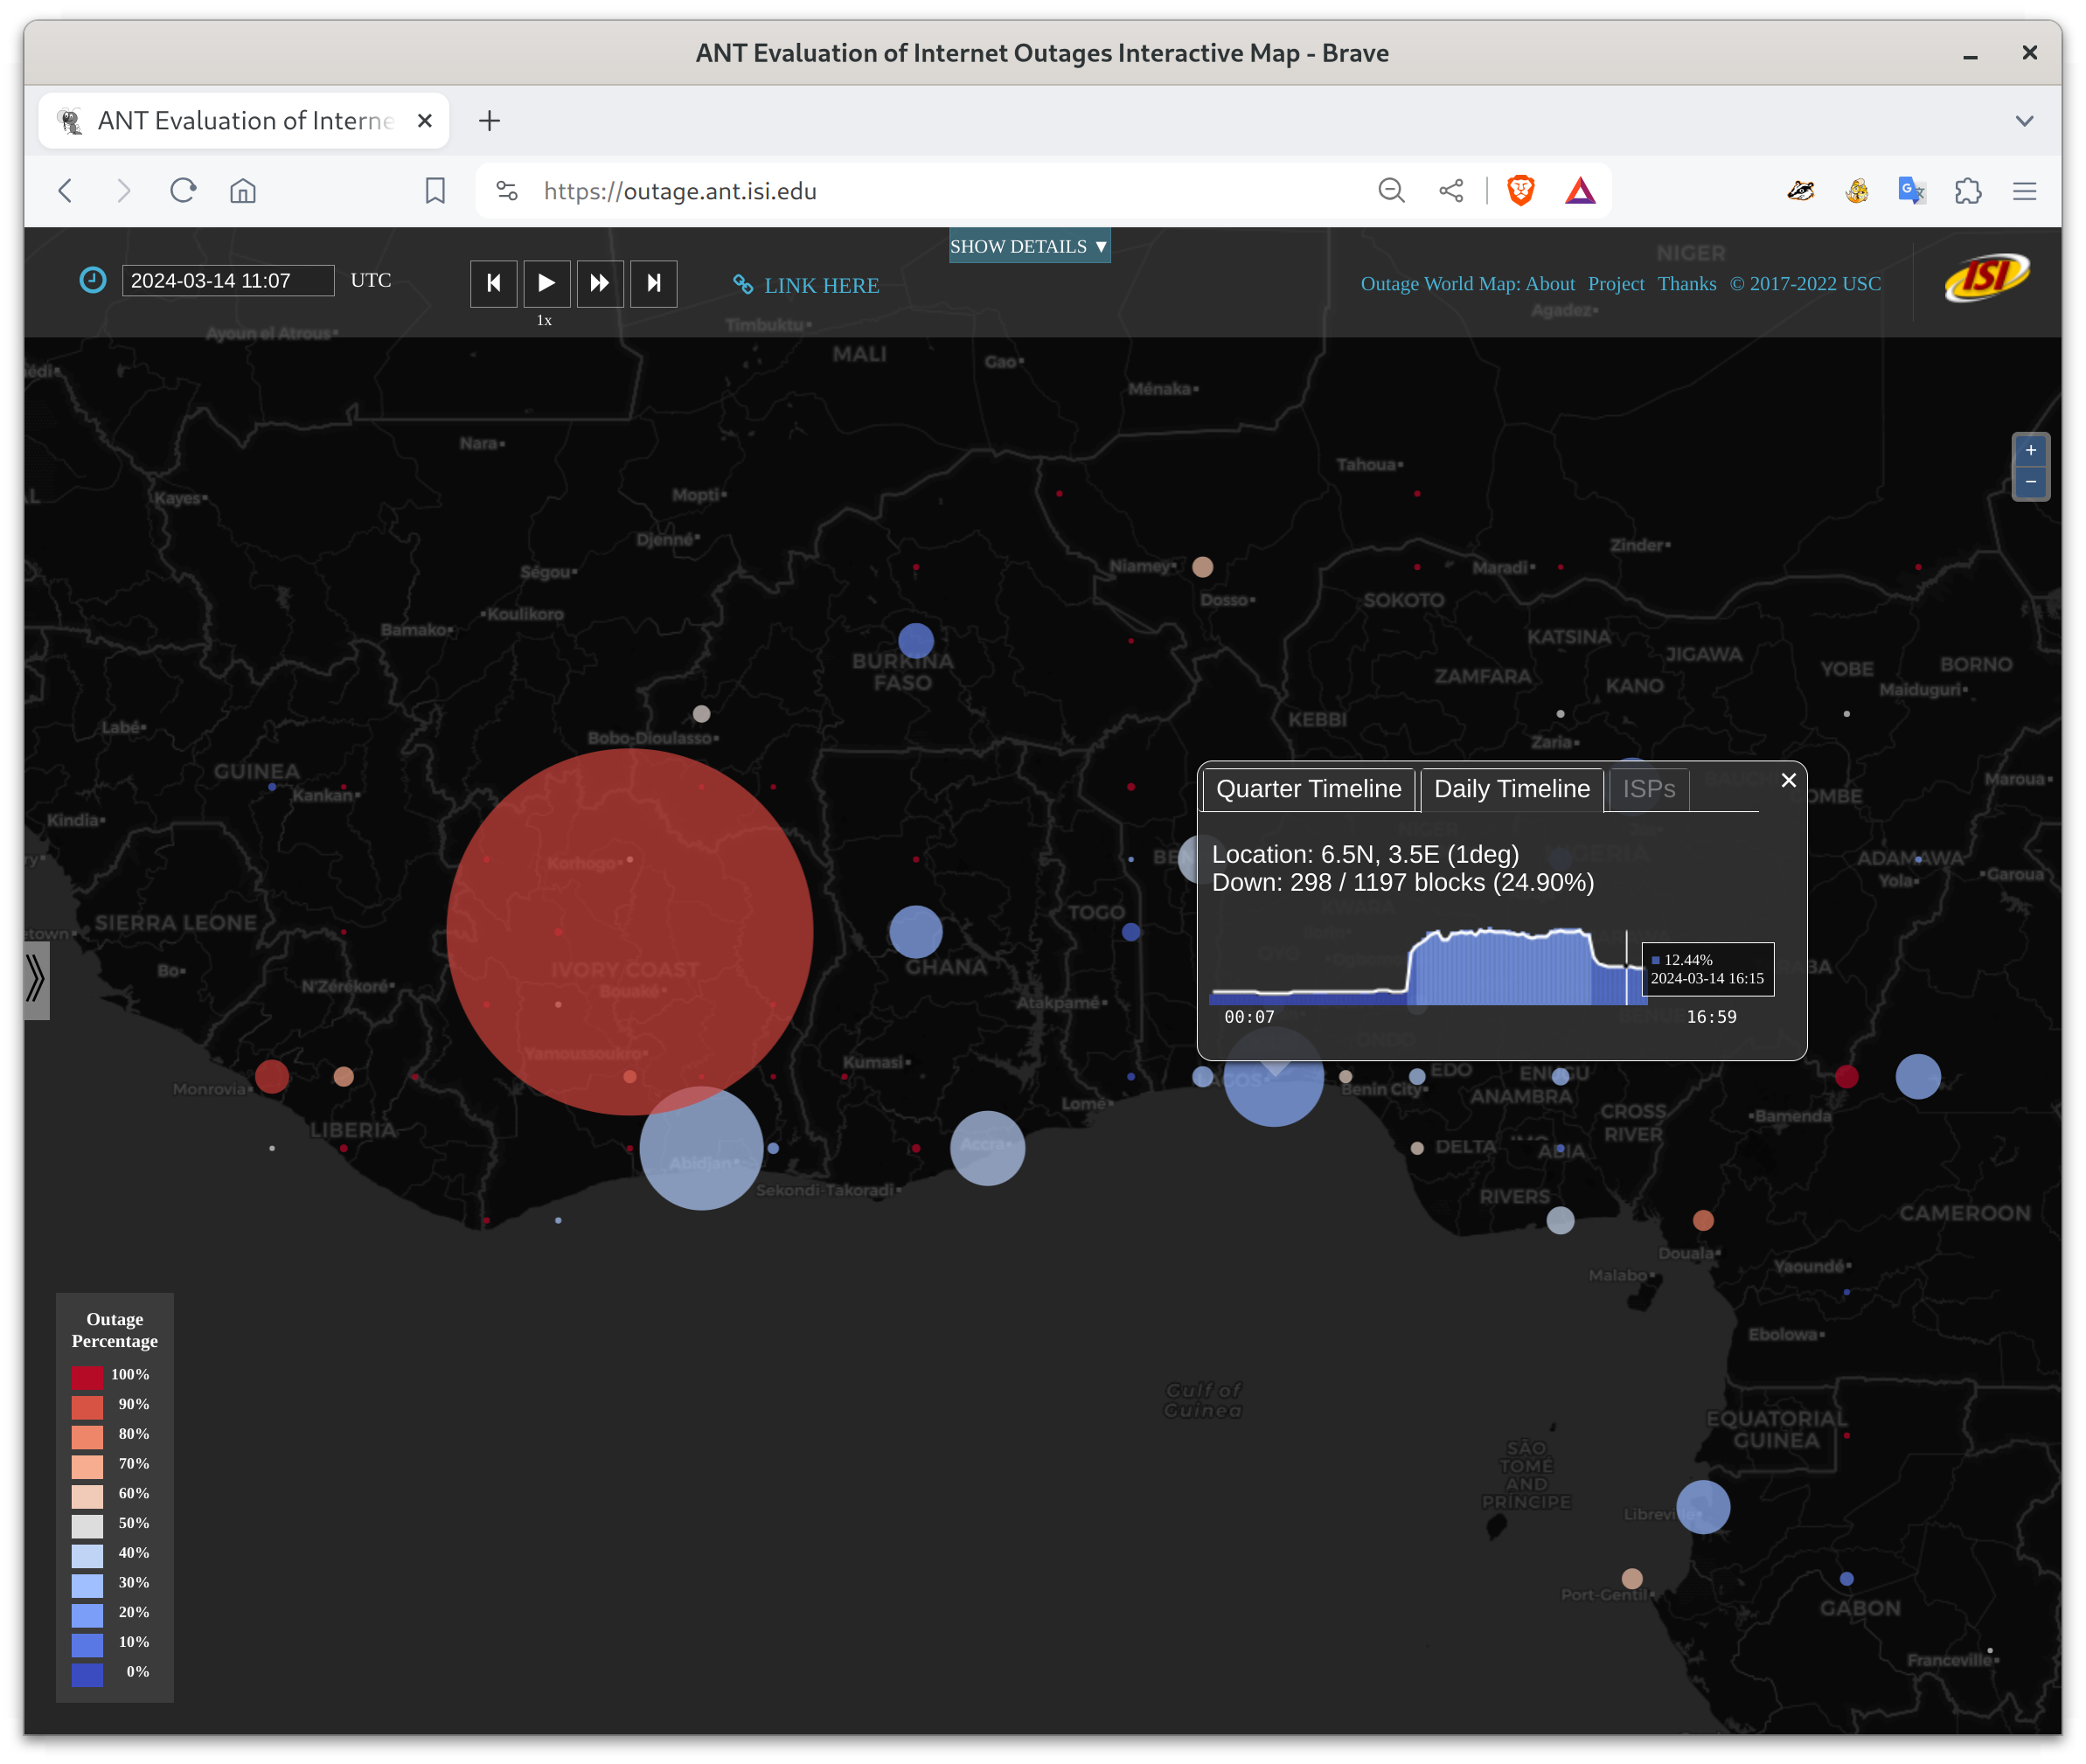
Serious Internet outages in Ivory Coast, beginning 2024-03-1409:00Z.
Fortunately some locations were able to partially recover from the problems, presumably by routing through different paths:
Lagos, Nigeria showed outages starting at 2024-03-14t08:00Z, with a partial recovery around t15:00Z.
The root cause for these outages is likely a problems in multiple undersea telecommunication cables, as has been reported in the Washington Post and the Guardian, among other places.
News reports indicate that Spectrum had a cable cut.
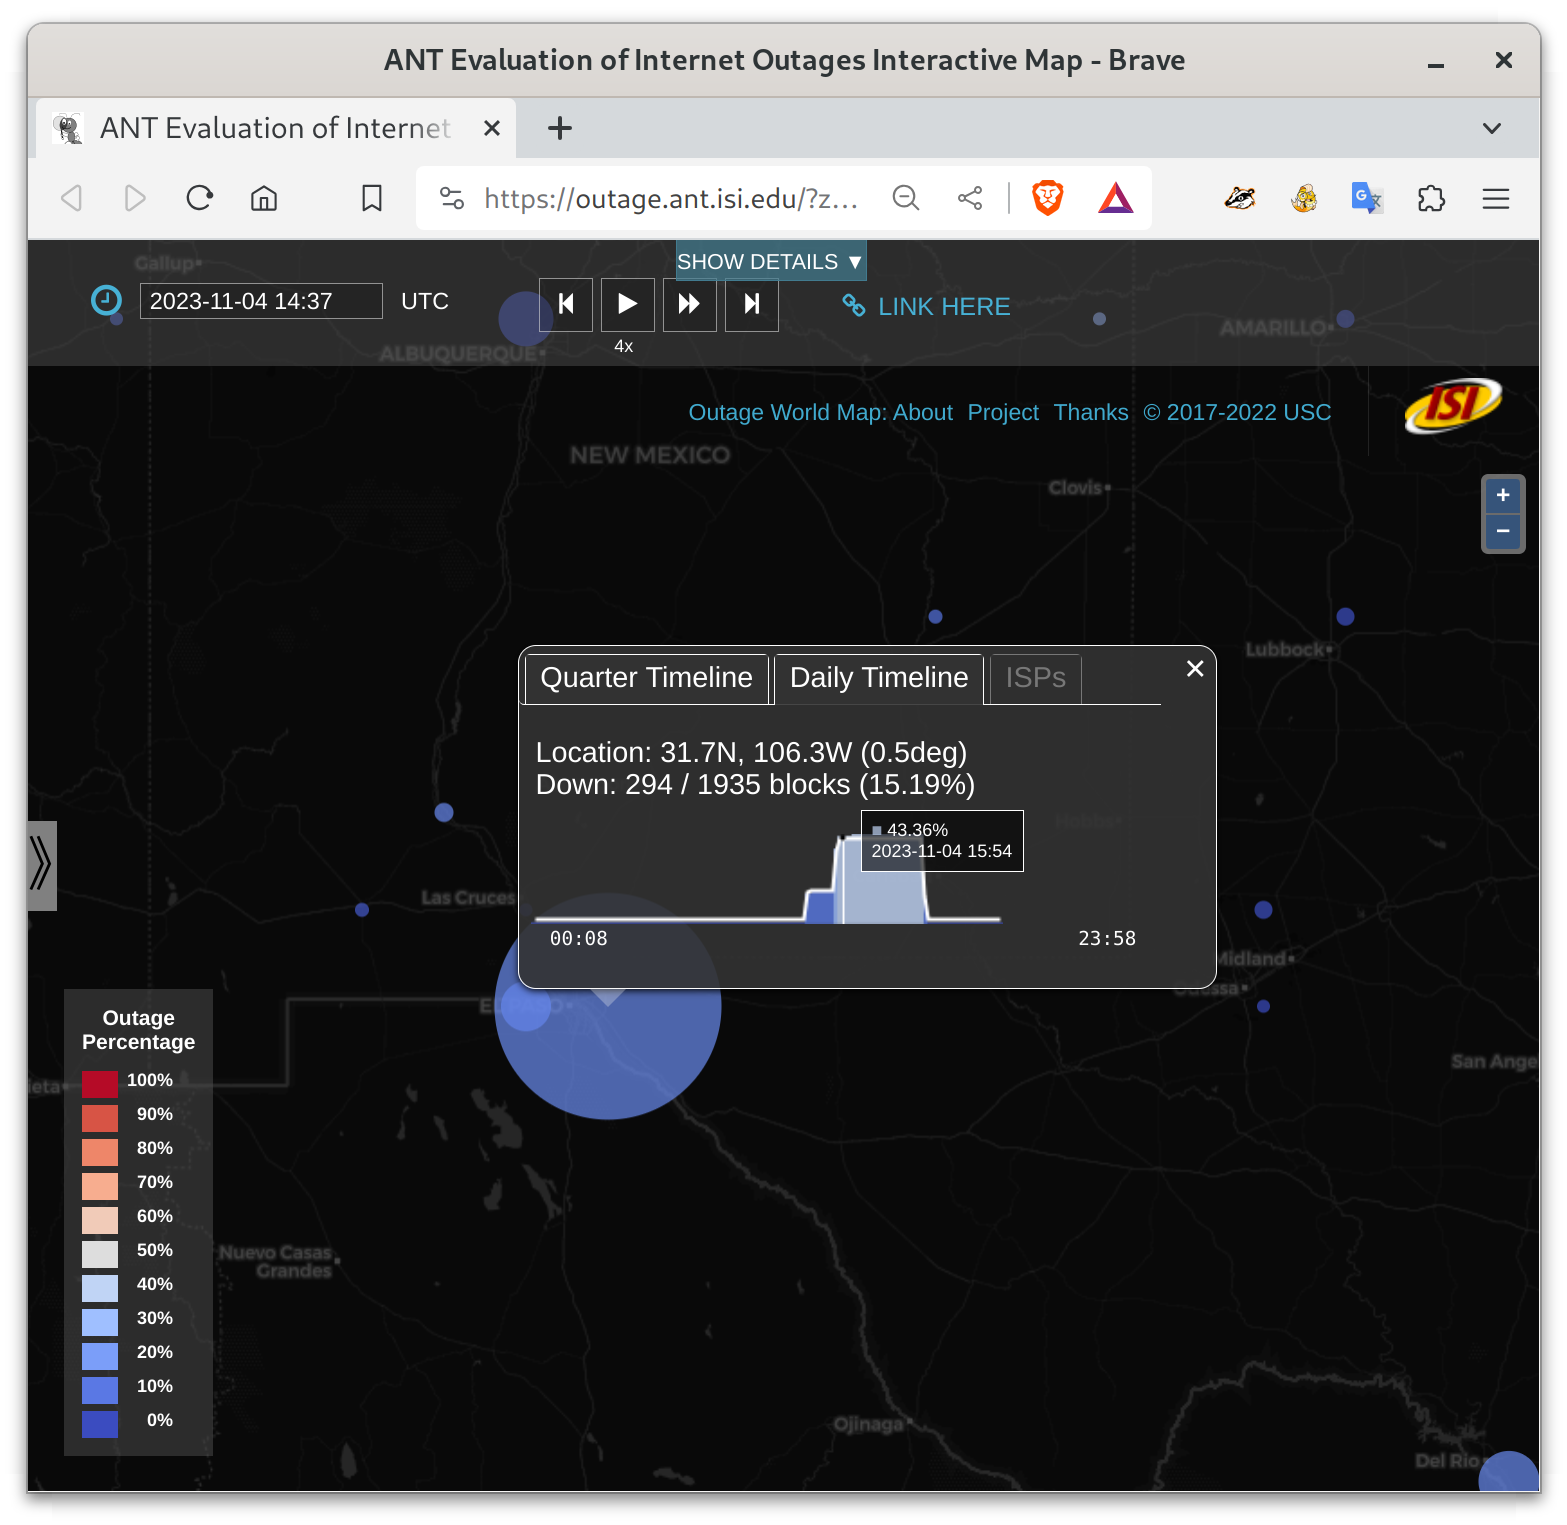
Trinocular showed an outage from 8:40am to 1:05pm (mountain time zone), with an smaller initial outage starting at 7am (2023-11-04t15:40 to t20:00 UTC, possibly starting at 14:00 UTC). This outage was quite severe, affecting more than 40% of the local networks that we monitor.
Cable cuts are hard to deal with, and we’re happy that they were able to restore service relatively quickly!