An Animation of the August 2020 CenturyLink Outage
On Sunday, August 30, 2020, CenturyLink suffered a network outage that affected much of their national network. This outage was noted in CNN and affected a number of customers using CenturyLink as a transit network provider. We have observing global network outages since December 2013 with Trinocular, and reporting outages near-real-time since January 2018.
We observed the CenturyLink outage in Trinocular’s near-real-time reporting.
Animating the Outage
The outage began about 2020-08-30t09:55 UTC (just before 6am EDT Sunday August 30).
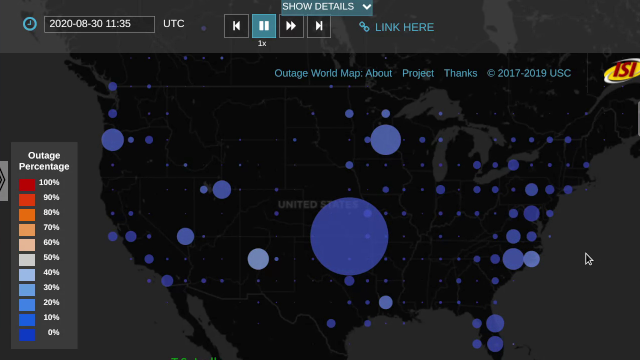
At t11:35Z, the outage is underway (in website). Click on the picture to see the animation:
(HTML5/MPEG-4 video)
In this image we show outages as circles on a geographic grid, here every 2-degree latitude/longitude. The area of each circle is proportional to the amount of IPv4 address space that is out. The color of circles is proportional to the percentage networks that are out.
Durin gthe outage see circles are larger across the United States than before the outage—thousands of networks are not reachable.
We are observing reachability from Los Angeles (from the University of Southern California); Washington DC (from USC’s Information Sciences Institute office there); Ft. Collins, Colorado (from Colorado State University); and abroad from Tokyo, Japan (Keio University and the Wide Project); Athens, Greece (the Athens University of Economics and Business); and the Netherlands (from SURFNet), so these reachability problems are widespread.
Before and After the Outage
The outage can be best seen by comparing before, during, and after.
Just before the event at 2020-08-30t09:23Z (in website):
before:
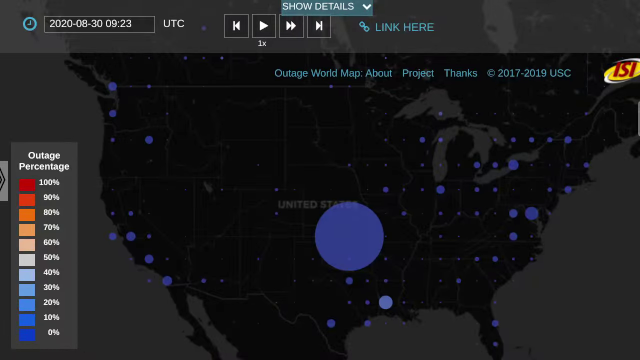
Most of these outages before the event are likely false positives—networks that responded in the past but have not responded in some time. We have algorithms to filter these gone dark networks from our data, but we are still in the process of adding thes algorithms to our near-real-time data feed.
The large circle in Kansas is due to geolocation uncertainty—Kansas is the home for networks whose location is in the U.S. but is otherwise uncertain.
during:
At t16:10Z we see the network has recovered (in website):
after:
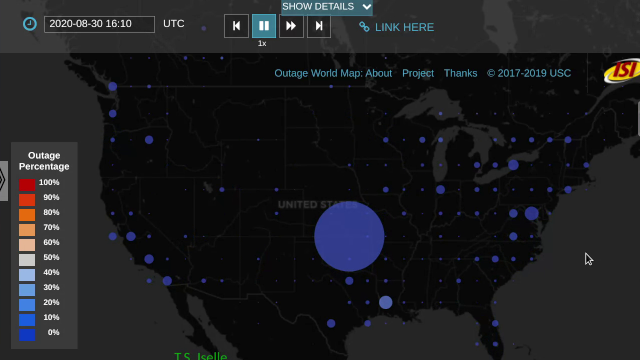
We see circles have returned to roughly the same sizes as “before”.
Implications of This Work
ZDNet summarized reports suggesting that this outage reduced global web traffic by a noticeable amount.
Outages this large are quite rare, but have occurred before, and smaller outages happen all the time.
We are continuing our research detecting Internet outages to try and quantify how often and how large outages are, as part of understanding what the Internet can tell us about our world. In addition to studying the Internet itself, we are interested in how it shows the extent of weather events such as hurricanes and we are studying if it can tell us about COVID-19 lockdowns.
Our near-real-time processing tools continue to evolve. In addition to implementing gone-dark detection to remove much of the before and after false positives, our data here shows only about 1/5th of all the blocks we measure. We currently scan, 24x7, about 5 million /24 network prefixes (each an IPv4 network like 192.0.2.*).
Getting the Data and More Information
We make our outage data available for research use every quarter
(this data will be in
dataset internet_outage_adaptive_a41-20200701 when it is released).
please contact us if you are interested.
For technical details about Trinocular and peer-reviewed papers, please see our outage web page.
Other’s posts about the CenturyLink event: Clouldflare’s blog
This work is supported by the the US Dept. of Homeland Security via the LACANIC Project (AFRL agreement FA8750-17-2-0280) and by the National Science Foundation through the MINCEQ and EIEIO (NSF Core-Small CNS-2007106) Projects.