Categories
Papers Publications

new conference paper “Quantifying Differences Between Batch and Streaming Detection of Internet Outages” in TMA 2025

The paper “Quantifying Differences Between Batch and Streaming Detection of Internet Outages” will appear in the 2025 Conference on Network Traffic Measurement and Analysis (TMA) June 10-13, 2025 in Copenhagen, Denmark. The batch and streaming datasets are available for download.
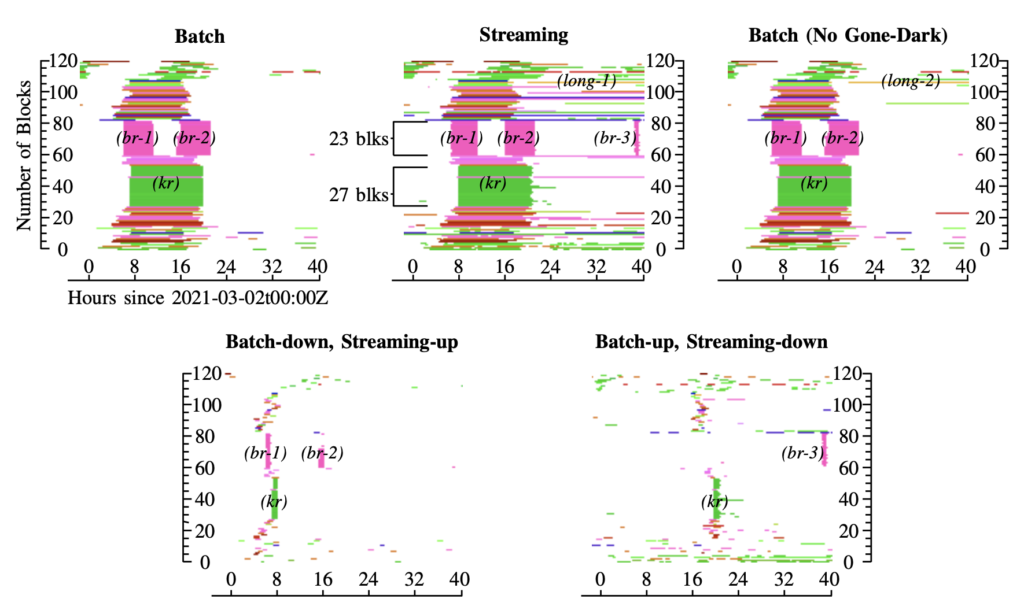
Visual representation of outages from 2021-03-01T22:00Z to 2021-03-03T20:00Z from batch and streaming datasets (Figure 3 from [Stutz23a])

From the paper’s abstract:

A number of different systems today detect outages
in the IPv4 Internet, often using active probing and algorithms
based on Trinocular’s Bayesian inference. Outage detection
methods have evolved, both to provide results in near-real-time,
and adding algorithms to account for important but less common
cases that might otherwise be misinterpreted. We compare two
implementations of active outage detection to see how choices
to optimize for near-real-time results with streaming compare
to designs that use long-term information to maximize accuracy
using batch processing. Examining 8 days of data, starting on
2021-02-26, we show that the two similar systems agree most of
the time, more than 84%. We show that only 0.2% of the time the
algorithms disagree, and 15% of the time only one reports. We
show these differences occur due to streaming’s requirement for
rapid decisions, precluding algorithms that consider long-term
data (days or weeks). These results are important to understand
the trade-offs that occur when balancing timely results with
accuracy. Beyond the two systems we compare, our results
suggest the role that algorithmic differences can have in similar
but different systems, such as the several implementations of
Trinocular-like active probing today.

Live data from Trinocular streams in to our outage website 24×7. The specific data used in this paper is available from our website.

This work is partially supported by the project “CNS Core: Small: Event Identification and Evaluation of Internet Outages (EIEIO)” (CNS-2007106) through the U.S. National Science Foundation, and by an REU supplement to that project. Erica Stutz began this work at Swarthmore College, working remotely for the University of Southern California; her current affiliation is Yale University.
Categories
Papers Publications

new symposium paper “Visualizing Internet Measurements of Covid-19 Work-from-Home” at IEEE Symposium on REU Research in Data Science, Systems, and Security

We published a new paper “Visualizing Internet Measurements of Covid-19 Work-from-Home” by Erica Stutz (Swarthmore College), Yuri Pradkin, Xiao Song, and John Heidemann (USC/ISI) at the Symposium for REU Research in Data Science, Systems, and Security, co-located with IEEE BigData 2021.

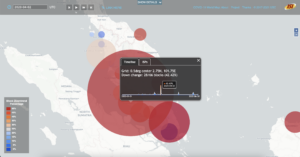
A screenshot from our Covid-WFH website showing an event in Malaysia on 2020-04-02.
A change in Internet use seen in Malaysia on 2020-04-02, present in our Covid-WFH data but discovered through our website.

From the abstract:

The Covid-19 pandemic disrupted the world as businesses and schools shifted to work-from-home (WFH), and comprehensive maps have helped visualize how those policies changed over time and in different places. We recently developed algorithms that infer the onset of WFH based on changes in observed Internet usage. Measurements of WFH are important to evaluate how effectively policies are implemented and followed, or to confirm policies in countries with less transparent journalism.This paper describes a web-based visualization system for measurements of Covid-19-induced WFH. We build on a web-based world map, showing a geographic grid of observations about WFH. We extend typical map interaction (zoom and pan, plus animation over time) with two new forms of pop-up information that allow users to drill-down to investigate our underlying data.We use sparklines to show changes over the first 6 months of 2020 for a given location, supporting identification and navigation to hot spots. Alternatively, users can report particular networks (Internet Service Providers) that show WFH on a given day.We show that these tools help us relate our observations to news reports of Covid-19-induced changes and, in some cases, lockdowns due to other causes. Our visualization is publicly available at https://covid.ant.isi.edu, as is our underlying data.

Datasets from this work will be available from our website and can be seen now at https://covid.ant.isi.edu. We thank NSF grants 2028279 and CNS-2007106 for supporting this work.