We are happy to share that two of our older topics have appeared more recently in other venues.
Our animations of the diurnal Internet, originally seen in our 2014 ACM IMC paper and our blogposts, was noticed by Gerald Smith who used it to start a discussion with seventh-grade classesin Mahe, India and (I think) Indiana, USA as part of his Fullbright work. It’s great to see research work that useful to middle-schoolers!
Kensuke Fukuda recently posted about our work on identifying IPv6 scanning with DNS backscatter at theAPNIC blog. This work was originally published at the 2018 ACM IMC and posted in our blog. It’s great to see that work get out to a new audience.
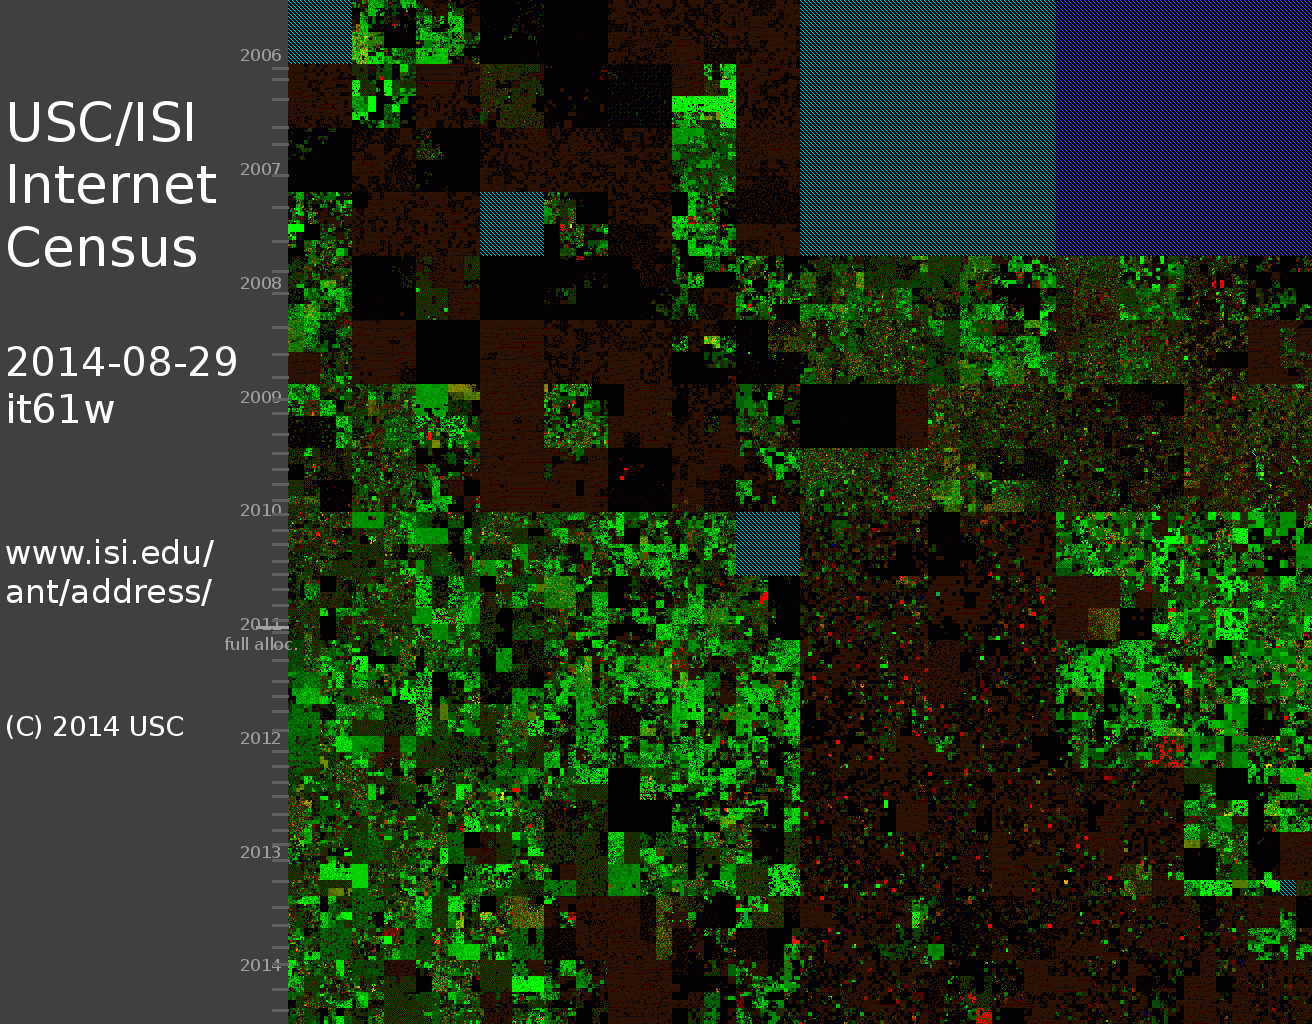
We’ve been taking Internet IPv4 censuses regularly since 2006. In each census, we probe the entire allocated IPv4 address space. You may browse 8 years of data at our IPv4 address browser.
A still image from our animation of 8 years of IPv4 censuses.
These eight years show some interesting events, from an early “open” Internet in 2006, to full allocation of IPv4 by ICANN in 2011, to higher utilization in 2014.
This animation was first shown at the Dec. 2014 DHS Cyber Security Division R&D Showcase and Technical Workshop as part of the talk “Towards Understanding Internet Reliability” given by John Heidemann. This work was supported by DHS, most recently through the LACREND project.
We have recently put together a video showing 35 days of Internet address usage as observed from Trinocular, our outage detection system.
The Internet sleeps: address use in South America is low (blue) in the early morning, while India is high (red) in afternoon.
The Internet sleeps: address use in South America is low (blue) in the early morning, while India is high (red) in afternoon. When we look at address usage over time, we see that some parts of the globe have daily swings of +/-10% to 20% in the number of active addresses. In China, India, eastern Europe and much of South America, the Internet sleeps.
Understanding when the Internet sleeps is important to understand how different country’s network policies affect use, it is part of outage detection, and it is a piece of improving our long-term goal of understanding exactly how big the Internet is.
This work is partly supported by DHS S&T, Cyber Security division, agreement FA8750-12-2-0344 (under AFRL) and N66001-13-C-3001 (under SPAWAR). The views contained
herein are those of the authors and do not necessarily represent those of DHS or the U.S. Government. This work was classified by USC’s IRB as non-human subjects research (IIR00001648).