The paper “Assessing Co-Locality of IP Blocks” appeared in the 19th IEEE Global Internet Symposium on April 11, 2016 in San Francisco, CA, USA and is available at (http://www.cs.colostate.edu/~manafgh/publications/Assessing-Co-Locality-of-IP-Block-GI2016.pdf). The datasets are available at (https://ant.isi.edu/datasets/geolocation/).
From the abstract:
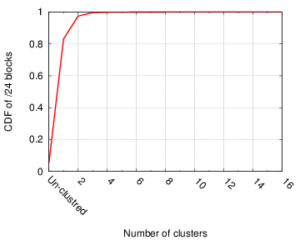
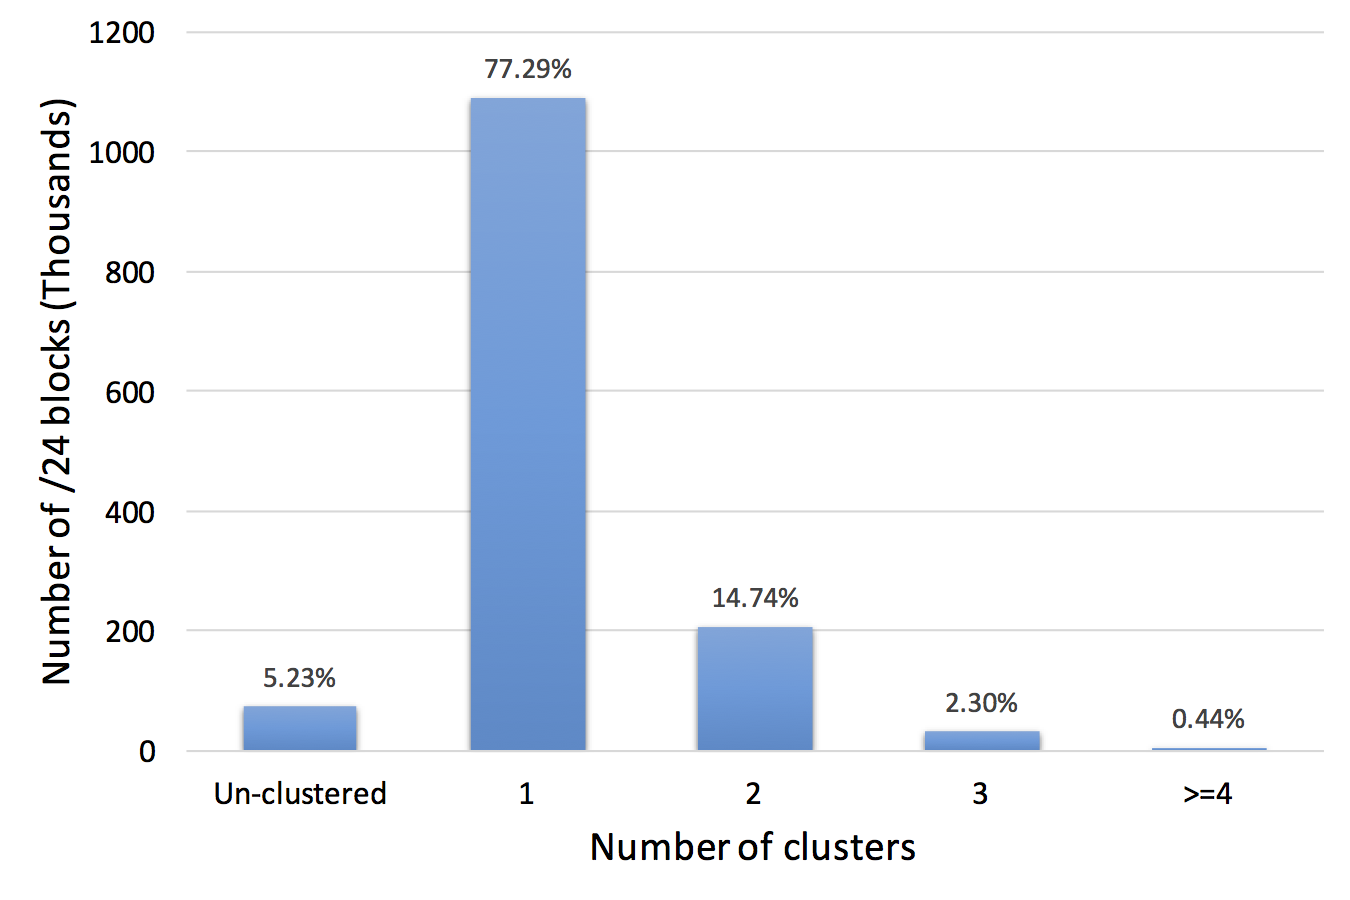 Many IP Geolocation services and applications assume that all IP addresses within the same /24 IPv4 prefix (a /24 block) reside in close physical proximity. For blocks that contain addresses in very different locations (such as blocks identifying network backbones), this assumption can result in a large geolocation error. In this paper we evaluate the co-location assumption. We first develop and validate a hierarchical clustering method to find clusters of IP addresses with similar observed delay measurements within /24 blocks. We validate our methodology against two ground-truth datasets, confirming that 93% of the identified multi-cluster blocks are true positives with multiple physical locations and an upper bound for false positives of only about 5.4%. We then apply our methodology to a large dataset of 1.41M /24 blocks extracted from a delay-measurement study of the entire responsive IPv4 address space. We find that about 247K (17%) out of 1.41M blocks are not co-located, thus quantifying the error in the /24 block co-location assumption.
The work in this paper is by Manaf Gharaibeh, Han Zhang, Christos Papadopoulos (Colorado State University) and John Heidemann (USC/ISI).
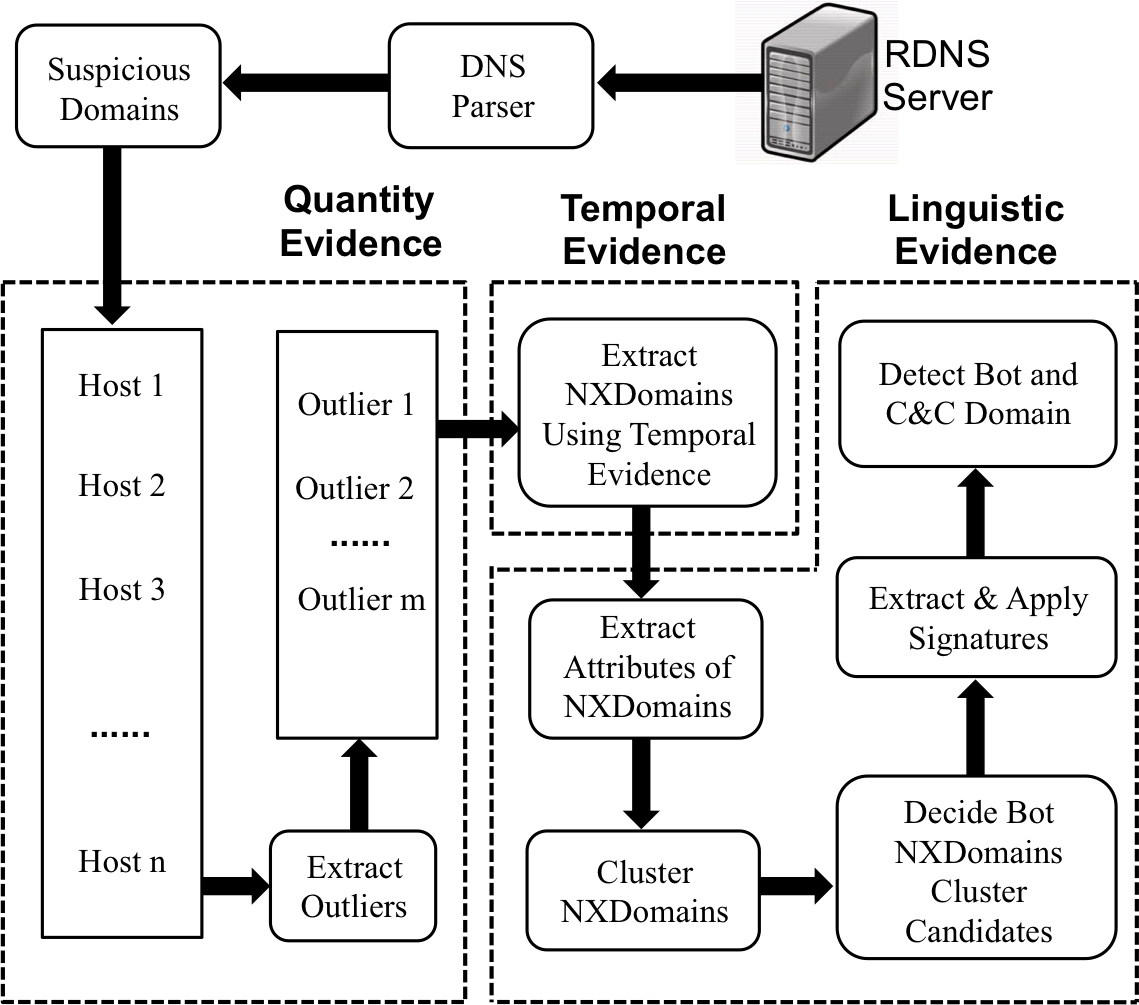
 These limitations make it very hard to detect individual bots when using traffic collected from a single network. In this paper, we introduce BotDigger, a system that detects DGA-based bots using DNS traffic without a priori knowledge of the domain generation algorithm. BotDigger utilizes a chain of evidence, including quantity, temporal and linguistic evidence