We would like to thank Ricardo Schmidt for joining us as a visiting scholar from October 2015 to February 2016. Ricardo visited us from the University of Twente in the Netherlands, and brought his passion for DNS and anycast.
A paper about some technical results from his visit will appear as a technical report shortly.
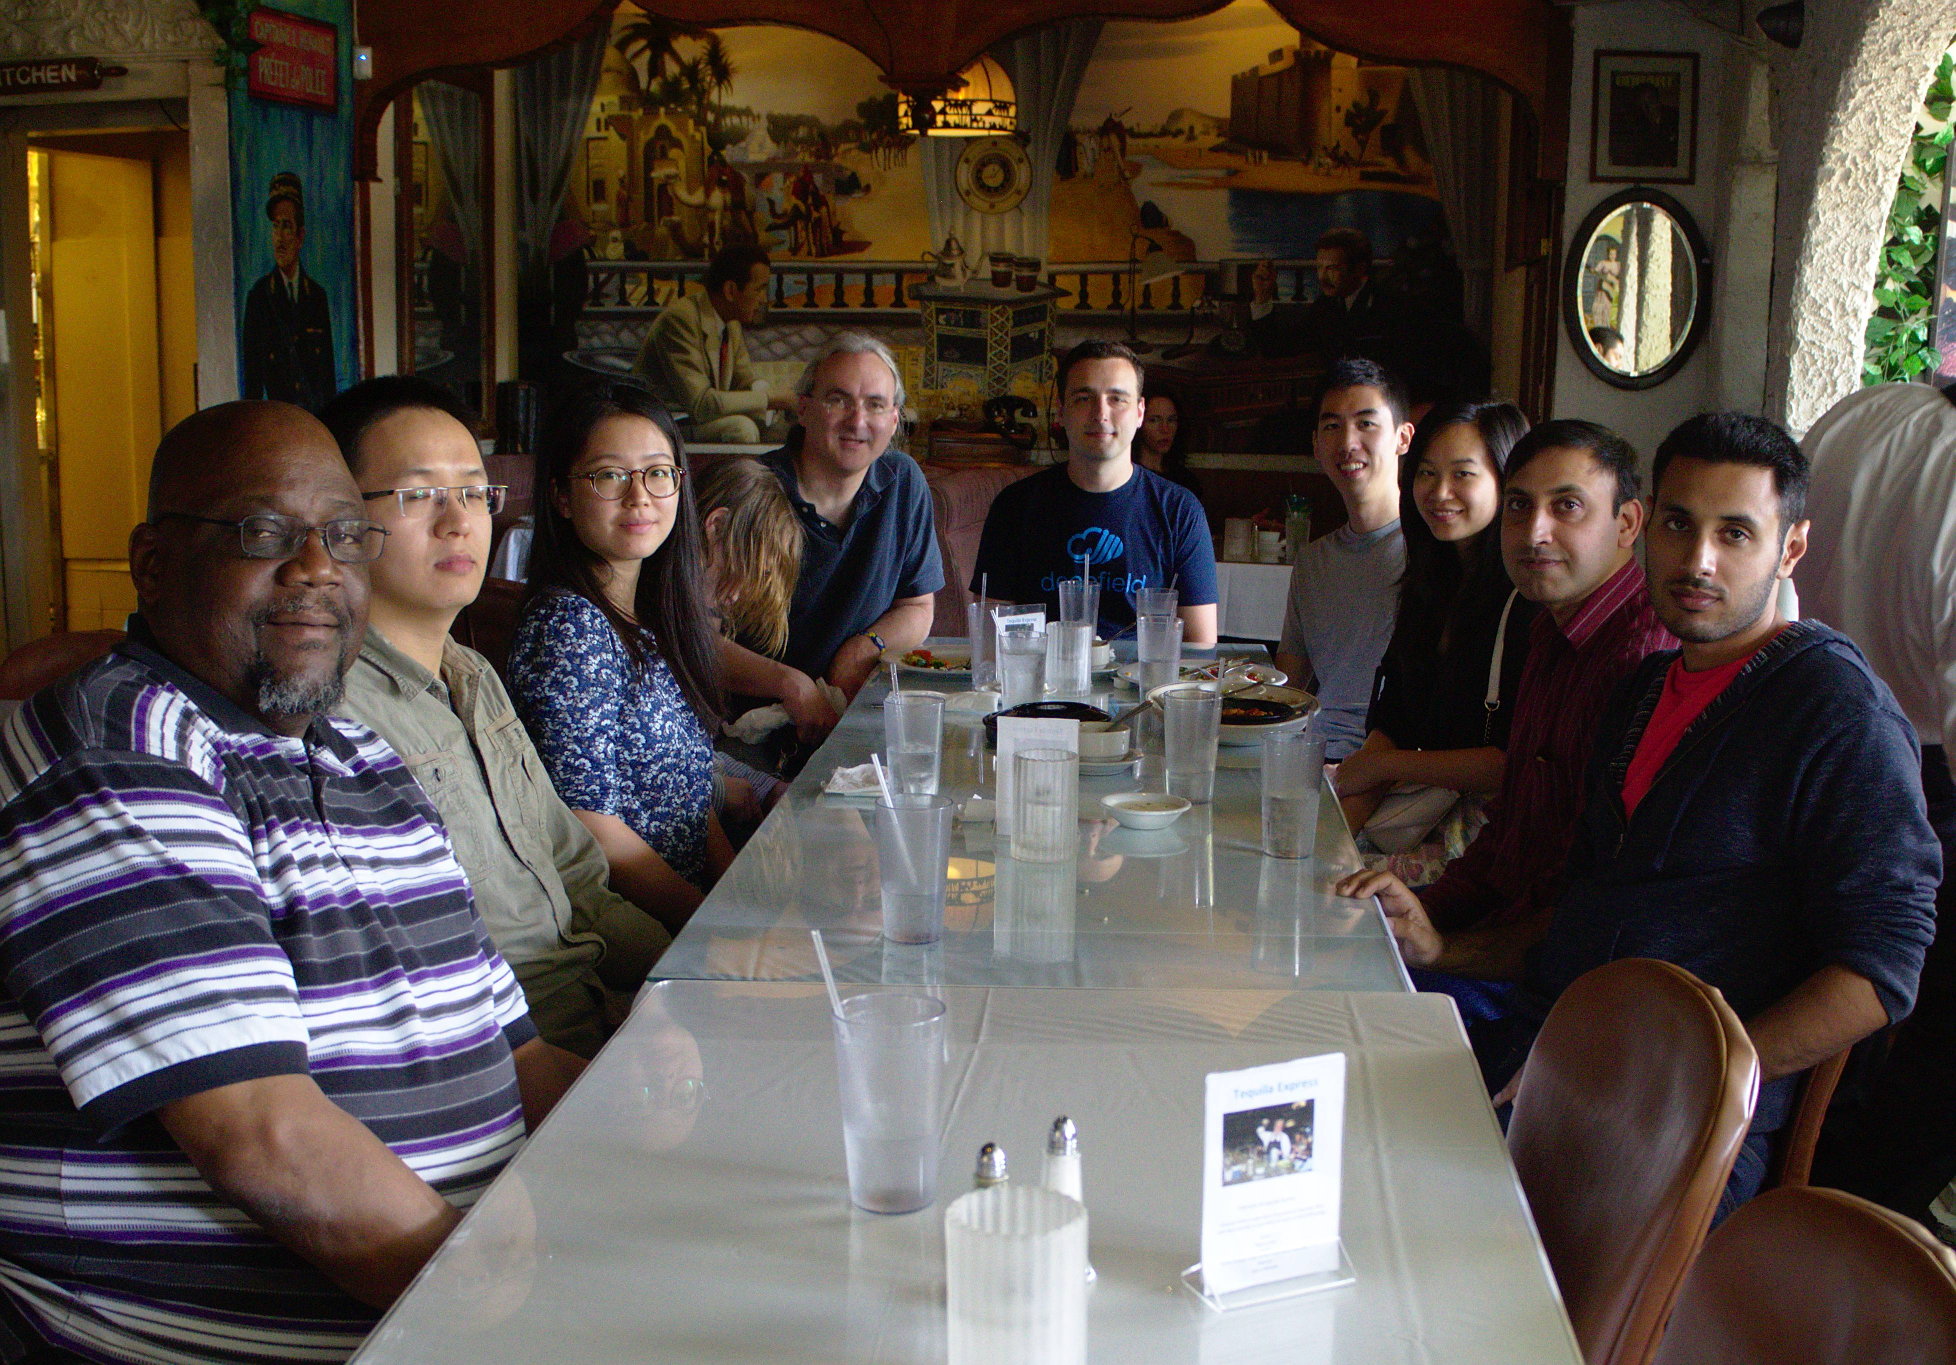
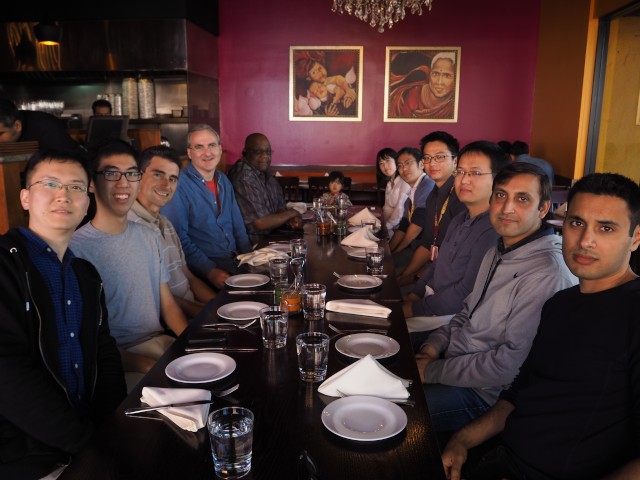
We sent him off in February 2016 with an ANT group lunch.
A going-away lunch for Ricardo Schmidt (at the head of the table), celebrating his time at USC/ISI as a visiting scholar, with the ANT lab and guests.
John Heidemann gave the talk “New Opportunities for Research and Experiments in Internet Naming And Identification” at the AIMS 2016 workshop at CAIDA, La Jolla, California on February 11, 2016. Slides are available at http://www.isi.edu/~johnh/PAPERS/Heidemann16a.pdf.
Needs for new naming and identity research prompt new research infrastructure, enabling new research directions.
From the abstract:
DNS is central to Internet use today, yet research on DNS today is challenging: many researchers find it challenging to create realistic experiments at scale and representative of the large installed base, and datasets are often short (two days or less) or otherwise limited. Yes DNS evolution presses on: improvements to privacy are needed, and extensions like DANE provide an opportunity for DNS to improve security and support identity management. We exploring how to grow the research community and enable meaningful work on Internet naming. In this talk we will propose new research infrastructure to support to realistic DNS experiments and longitudinal data studies. We are looking for feedback on our proposed approaches and input about your pressing research problems in Internet naming and identification.
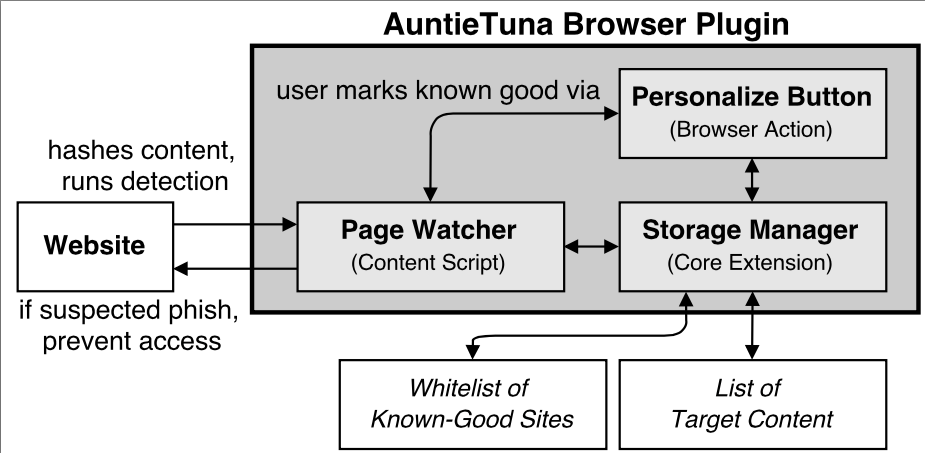
Phishing sites masquerade as copies of legitimate sites (“targets”) to fool people into sharing sensitive information that can then be used for fraud. Current phishing defenses can be ineffective, with training ignored, blacklists of discovered, bad sites too slow to pick up new threats, and whitelists of known-good sites too limiting. We have developed a new technique that automatically builds personalized lists of target sites (candidates that may be copied by phish) and then tests sites as a user browses them. Our approach uses cryptographic hashing of each page’s rendered Document Object Model (DOM), providing a zero false positive rate and identifying more than half of detectable phish in a controlled study. Since each user develops a customized list of target sites, our approach presents a diverse defense against phishers. We have prototyped our approach as a Chrome browser plugin called AuntieTuna, emphasizing usability through automated and simple manual addition of target sites and clean reports of potential phish that include context about the targeted site. AuntieTuna does not slow web browsing time and presents alerts on phishing pages before users can divulge information. Our plugin is open-source and has been in use by a few users for months.
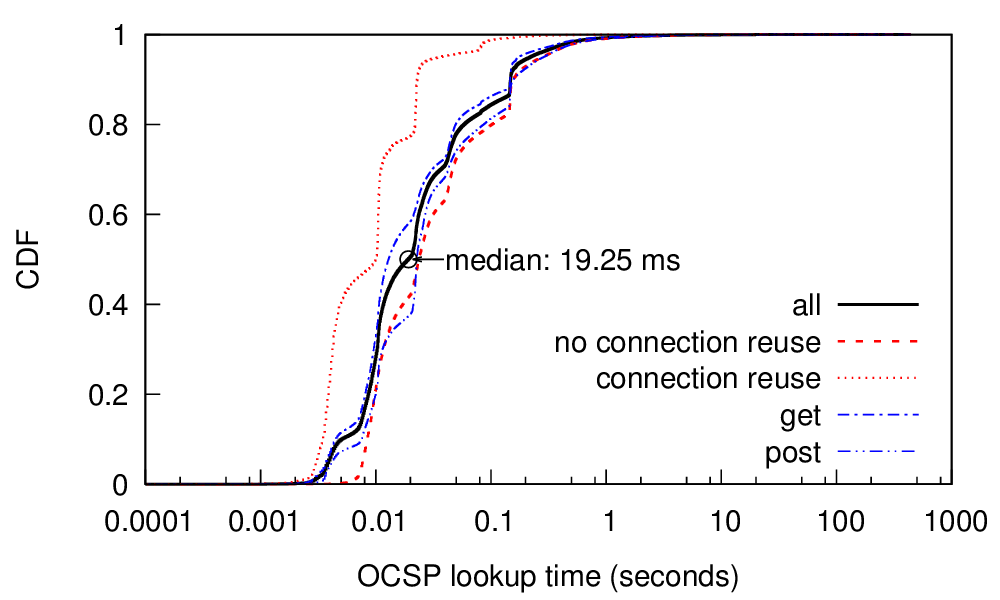
Today, Transport-Layer Security (TLS) is the bedrock of Internet security for the web and web-derived applications. TLS depends on the X.509 Public Key Infrastructure (PKI) to authenticate endpoint
identity. An essential part of a PKI is the ability to quickly revoke certificates, for example, after a key compromise. Today the Online Certificate Status Protocol (OCSP) is the most common way to quickly distribute revocation information. However, prior and current concerns about OCSP latency and privacy raise questions about its use. We examine OCSP using passive network monitoring of live traffic at the Internet uplink of a large research university and verify the results using active scans. Our measurements show that the median latency of OCSP queries is quite good: only 20 ms today, much less than the 291 ms observed in 2012. This improvement is because content delivery networks (CDNs) serve most OCSP traffic today; our measurements show 94% of queries are served by CDNs. We also show that OCSP use is ubiquitous today: it is used by all popular web browsers, as well as important non-web applications such as MS-Windows code signing.
The work in the paper is by Liang Zhu (USC/ISI), Johanna Amann (ICSI) and John Heidemann (USC/ISI). The active probe dataset in this paper is available upon request.
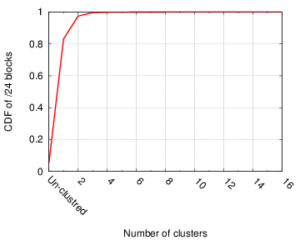
CDF of number of clusters per block, suggesting the number of potential multi-location blocks. (Figure 2 from [Gharaibeh15a].)
Many IP Geolocation services and applications assume that all IP addresses with the same /24 IPv4 prefix (a /24 block) are in the same location. For blocks that contain addresses in very different locations (such blocks identifying network backbones), this assumption can result in large geolocation error. This paper evaluates this assumption using a large dataset of 1.41M /24 blocks extracted from a delay measurements dataset for the entire
responsive IPv4 address space. We use hierarchal clustering to find clusters of IP addresses with similar observed delay measurements within /24 blocks. Blocks with multiple clusters often span different geographic locations. We evaluate this claim against two ground-truth datasets, confirming that 93% of identified multi-cluster blocks are true positives with multiple locations, while only 13% of blocks identified as single-cluster appear to be multi-location in ground truth. Applying the clustering process to the whole dataset suggests that about 17% (247K) of blocks are likely multi-location.
This work is by Manaf Gharaibeh, Han Zhang, Christos Papadopoulos (Colorado State University), and John Heidemann (USC/ISI). The datasets used in this work are new analysis of an existing geolocation dataset as collected by Hu et al. (http://www.isi.edu/~johnh/PAPERS/Hu12a.pdf). These source datasets are available upon request from http://www.predict.org and via our website, and we expect trial datasets in our new work to also be available there and through PREDICT by the end of 2015.
ANT will be looking for one (or perhaps two) strong PhD students interested in our areas of research to start at USC in Fall 2016. If you’re interested in working with our research group, please apply to our PhD program (the deadline is December 15, 2015 and the CS department has application information).
For MS students at USC, we sometimes to directed research projects, usually as part of CSci551 or CSci651–if you’re interested, please read our webpage with specific MS-student advice.
The paper “Detecting Malicious Activity with DNS Backscatter” will appear at the ACM Internet Measurements Conference in October 2015 in Tokyo, Japan. A copy is available at http://www.isi.edu/~johnh/PAPERS/Fukuda15a.pdf).
How newtork activity generates DNS backscatter that is visible at authority servers. (Figure 1 from [Fukuda15a]).From the abstract:
Network-wide activity is when one computer (the originator) touches many others (the targets). Motives for activity may be benign (mailing lists, CDNs, and research scanning), malicious (spammers and scanners for security vulnerabilities), or perhaps indeterminate (ad trackers). Knowledge of malicious activity may help anticipate attacks, and understanding benign activity may set a baseline or characterize growth. This paper identifies DNS backscatter as a new source of information about network-wide activity. Backscatter is the reverse DNS queries caused when targets or middleboxes automatically look up the domain name of the originator. Queries are visible to the authoritative DNS servers that handle reverse DNS. While the fraction of backscatter they see depends on the server’s location in the DNS hierarchy, we show that activity that touches many targets appear even in sampled observations. We use information about the queriers to classify originator activity using machine-learning. Our algorithm has reasonable precision (70-80%) as shown by data from three different organizations operating DNS servers at the root or country-level. Using this technique we examine nine months of activity from one authority to identify trends in scanning, identifying bursts corresponding to Heartbleed and broad and continuous scanning of ssh.
The work in this paper is by Kensuke Fukuda (NII/Sokendai) and John Heidemann (USC/ISI) and was begun when Fukuda-san was a visiting scholar at USC/ISI. Kensuke Fukuda’s work in this paper is partially funded by Young Researcher Overseas Visit Program by Sokendai, JSPS Kakenhi, and the Strategic International Collaborative R&D Promotion Project of the Ministry of Internal Affairs and Communication in Japan, and by the European Union Seventh Framework Programme. John Heidemann’s work is partially supported by US DHS S&T, Cyber Security division.
We would like to thank Kensuke Fukuda for joining us as a visiting scholar from September 2014 to January 2015. It was great having Fukuda-san join us from the National Institute of Informatics in Japan and share is interest in network measurement and DNS.
Watch here for details about the technical results of his visit. For now though, a photo of our going-away lunch with Kenuske, his family, and most of rest of the ANT lab taken in January 2015.
The going away lunch for Kensuke Fukuda (fifth from the right), celebrating his visiting as a scholar, with the ANT lab.
After more than ten years of hand-coded, mostly-themed HTML, we’ve finally revamped our website with Jekyll and moved it to our own server at https://ant.isi.edu/. We love producing papers, software, and datasets, and we now finally automate the tedious task cross-referencing these across our pages. It also brings more consistent theming, and our server brings HTTPS for better privacy.
Thanks to Calvin Ardi for kicking this off, and to almost everyone in the group for pitching in to go over old pages.
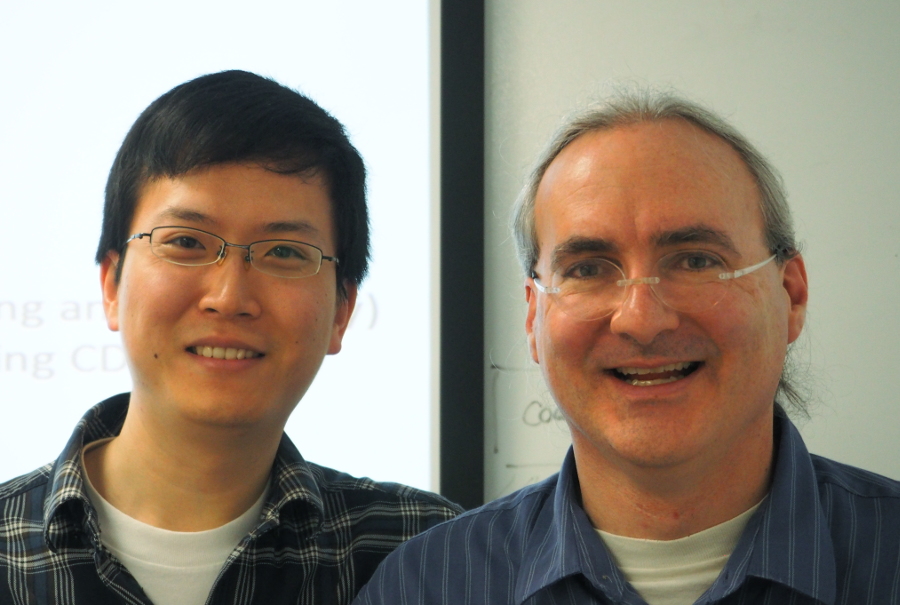
I would like to congratulate Dr. Xun Fan for defending his PhD in May 2015 and completing his doctoral dissertation “Enabling Efficient Service Enumeration Through Smart Selection of Measurements” in July 2015.
Xun Fan (left) and John Heidemann, after Xun’s PhD defense.
From the abstract:
The Internet is becoming more and more important in our daily lives. Both the government and industry invest in the growth of the Internet, bringing more users to the world of networks. As the Internet grows, researchers and operators need to track and understand the behavior of global Internet services to achieve smooth operation. Active measurements are often used to study behavior of large Internet service, and efficient service enumeration is required. For example, studies of Internet topology may need active probing to all visible network prefixes; monitoring large replicated service requires periodical enumeration of all service replicas. To achieve efficient service enumeration, it is important to select probing sources and destinations wisely. However, there are challenges for making smart selection of probing sources and destinations. Prior methods to select probing destinations are either inefficient or hard to maintain. Enumerating replicas of large Internet services often requires many widely distributed probing sources. Current measurement platforms don’t have enough probing sources to approach complete enumeration of large services.
This dissertation makes the thesis statement that smart selection of probing sources and destinations enables efficient enumeration of global Internet services to track and understand their behavior. We present three studies to demonstrate this thesis statement. First, we propose new automated approach to generate a list of destination IP addresses that enables efficient enumeration of Internet edge links. Second, we show that using large number of widely distributed open resolvers enables efficient enumeration of anycast nodes which helps study abnormal behavior of anycast DNS services. In our last study, we efficiently enumerate Front-End (FE) Clusters of Content Delivery Networks (CDNs) and use the efficient enumeration to track and understand the dynamics of user-to-FE Cluster mapping of large CDNs. We achieve the efficient enumeration of CDN FE Clusters by selecting probing sources from a large set of open resolvers. Our selected probing sources have smaller number of open resolvers but provide same coverage on CDN FE Cluster as the larger set.
In addition to our direct results, our work has also been used by several published studies to track and understand the behavior of Internet and large network services. These studies not only support our thesis as additional examples but also suggest this thesis can further benefit many other studies that need efficient service enumeration to track and understand behavior of global Internet services.