We would like to thank Kensuke Fukuda for joining us as a visiting scholar from September 2014 to January 2015. It was great having Fukuda-san join us from the National Institute of Informatics in Japan and share is interest in network measurement and DNS.
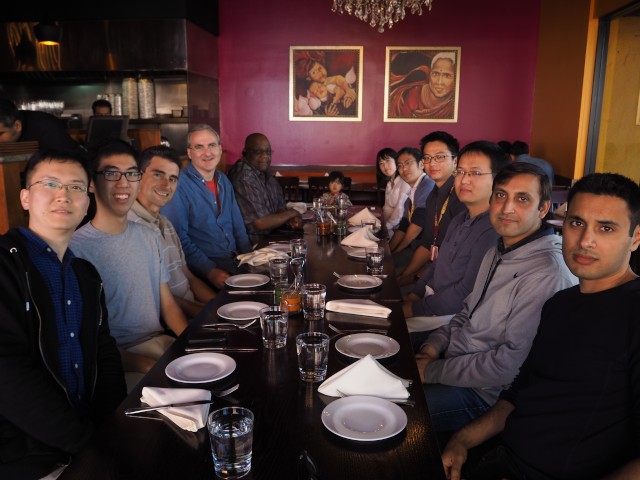
Watch here for details about the technical results of his visit. For now though, a photo of our going-away lunch with Kenuske, his family, and most of rest of the ANT lab taken in January 2015.
The going away lunch for Kensuke Fukuda (fifth from the right), celebrating his visiting as a scholar, with the ANT lab.
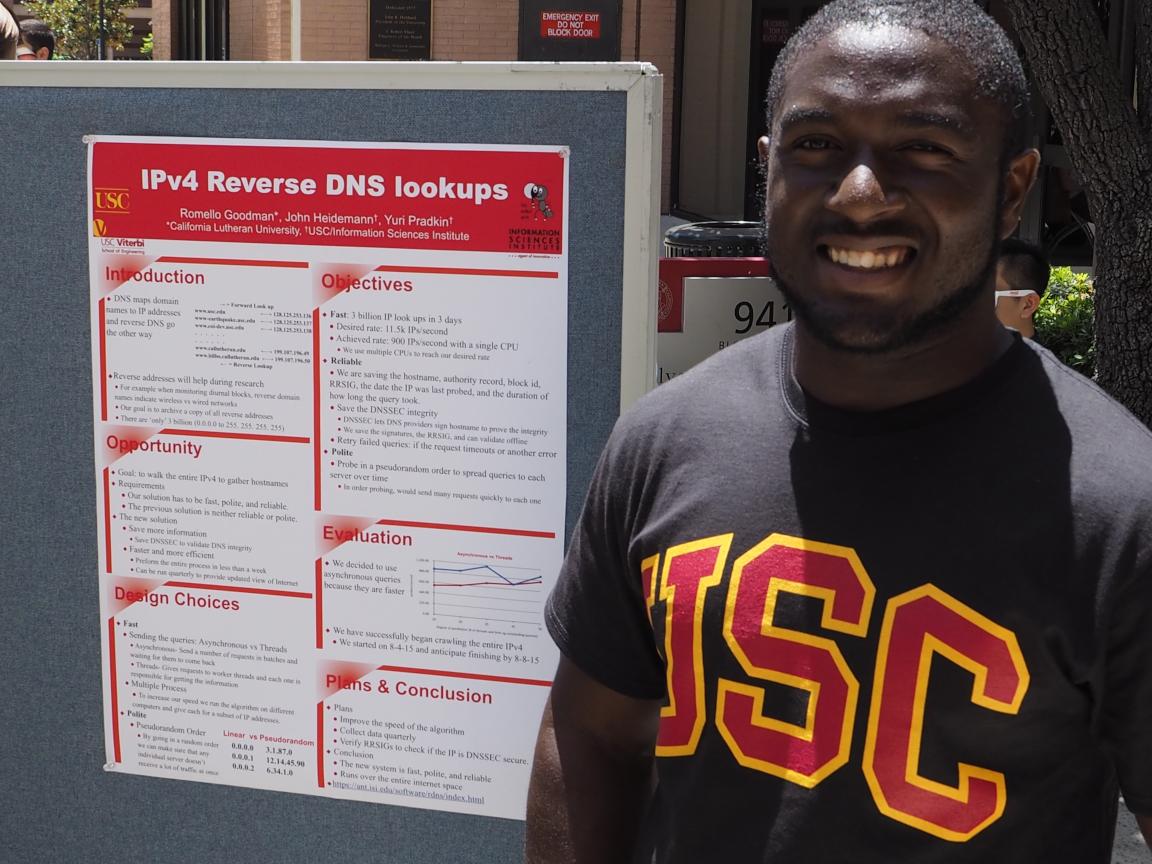
Romello Goodman with his poster about his reverse-DNS crawling work, at the SURE poster session.
Romello’s project was developing a reverse DNS crawler for IPv4 to provide bulk domain name data that feeds into other research projects such as our Internet census work. He explored several approaches and his code is running today crawling the whole Internet. We have used other sources of DNS data in the past–we look forward to his approaches providing a regularly updated dataset for evaluation.
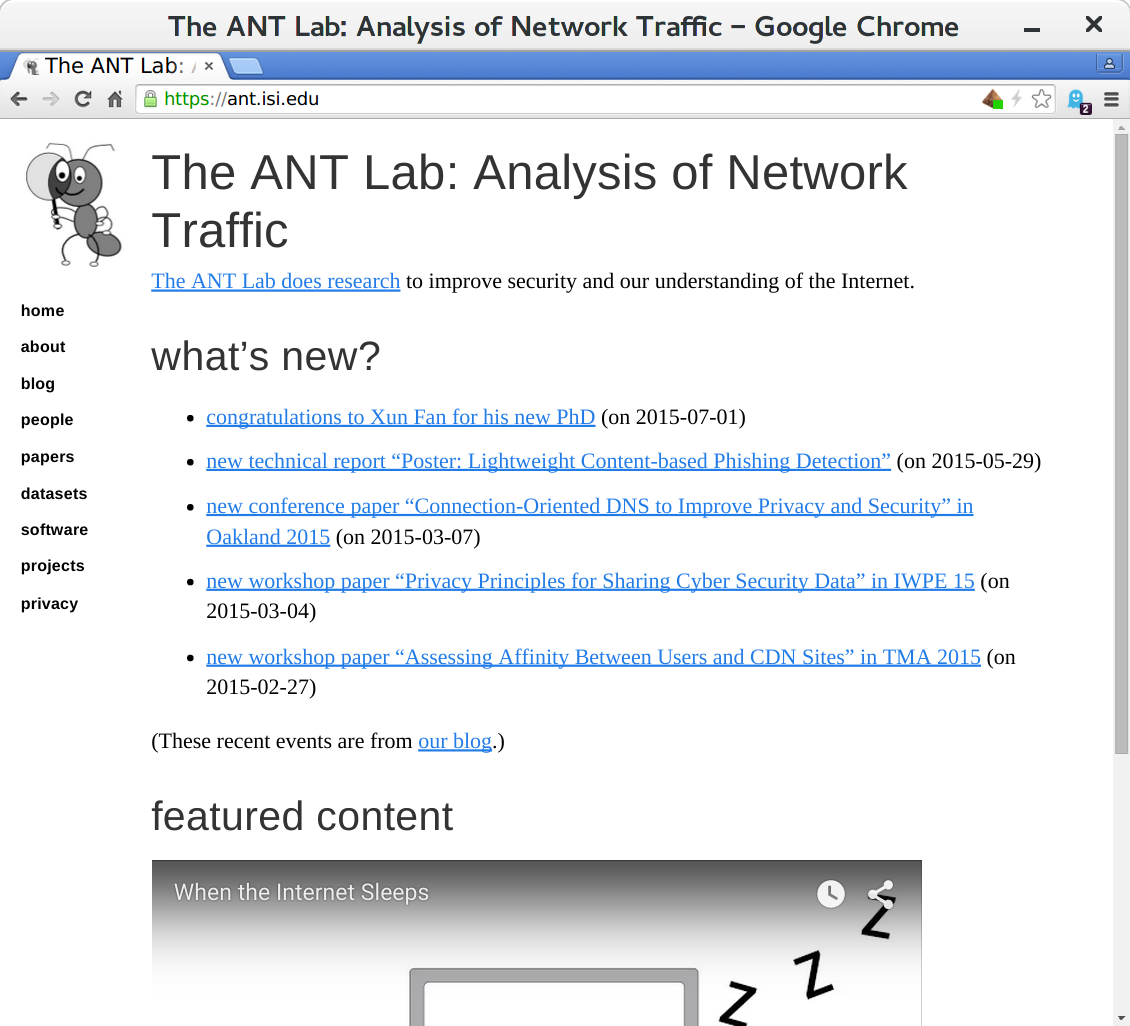
After more than ten years of hand-coded, mostly-themed HTML, we’ve finally revamped our website with Jekyll and moved it to our own server at https://ant.isi.edu/. We love producing papers, software, and datasets, and we now finally automate the tedious task cross-referencing these across our pages. It also brings more consistent theming, and our server brings HTTPS for better privacy.
Thanks to Calvin Ardi for kicking this off, and to almost everyone in the group for pitching in to go over old pages.
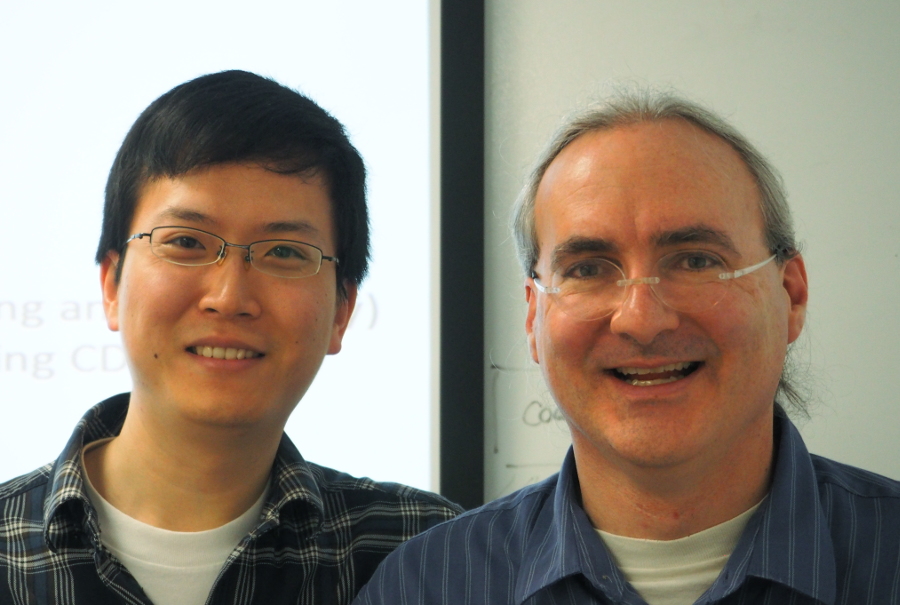
I would like to congratulate Dr. Xun Fan for defending his PhD in May 2015 and completing his doctoral dissertation “Enabling Efficient Service Enumeration Through Smart Selection of Measurements” in July 2015.
Xun Fan (left) and John Heidemann, after Xun’s PhD defense.
From the abstract:
The Internet is becoming more and more important in our daily lives. Both the government and industry invest in the growth of the Internet, bringing more users to the world of networks. As the Internet grows, researchers and operators need to track and understand the behavior of global Internet services to achieve smooth operation. Active measurements are often used to study behavior of large Internet service, and efficient service enumeration is required. For example, studies of Internet topology may need active probing to all visible network prefixes; monitoring large replicated service requires periodical enumeration of all service replicas. To achieve efficient service enumeration, it is important to select probing sources and destinations wisely. However, there are challenges for making smart selection of probing sources and destinations. Prior methods to select probing destinations are either inefficient or hard to maintain. Enumerating replicas of large Internet services often requires many widely distributed probing sources. Current measurement platforms don’t have enough probing sources to approach complete enumeration of large services.
This dissertation makes the thesis statement that smart selection of probing sources and destinations enables efficient enumeration of global Internet services to track and understand their behavior. We present three studies to demonstrate this thesis statement. First, we propose new automated approach to generate a list of destination IP addresses that enables efficient enumeration of Internet edge links. Second, we show that using large number of widely distributed open resolvers enables efficient enumeration of anycast nodes which helps study abnormal behavior of anycast DNS services. In our last study, we efficiently enumerate Front-End (FE) Clusters of Content Delivery Networks (CDNs) and use the efficient enumeration to track and understand the dynamics of user-to-FE Cluster mapping of large CDNs. We achieve the efficient enumeration of CDN FE Clusters by selecting probing sources from a large set of open resolvers. Our selected probing sources have smaller number of open resolvers but provide same coverage on CDN FE Cluster as the larger set.
In addition to our direct results, our work has also been used by several published studies to track and understand the behavior of Internet and large network services. These studies not only support our thesis as additional examples but also suggest this thesis can further benefit many other studies that need efficient service enumeration to track and understand behavior of global Internet services.
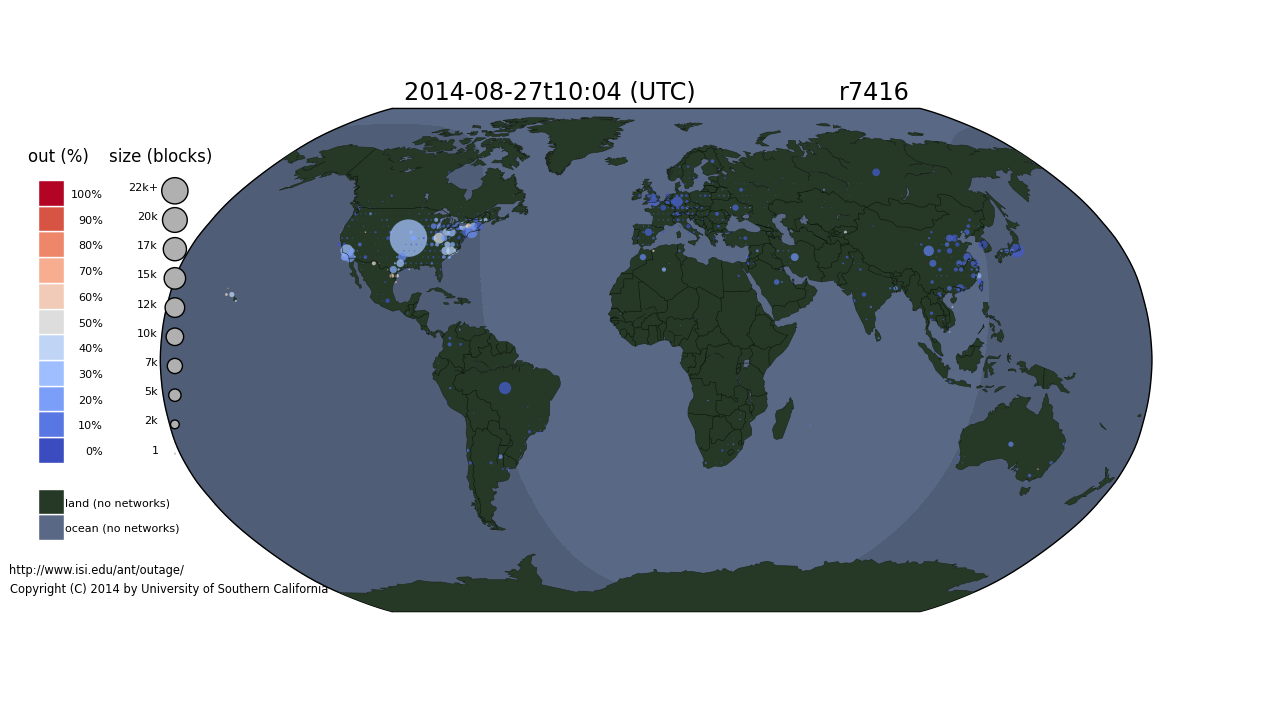
Global network outages on 2014-08-27 during the Time Warner event in the U.S.
On August 27, 2014, Time Warner suffered a network outage that affected about 11 million customers for more than two hours (makingnationalnews). We have observing global network outages since December 2013, including this outage.
We see that the Time Warner outage lasted about two hours and affected a good swath of the United States. We caution that all large network operators have occasional outages–this animation is not intended to complain about Time Warner, but to illustrate the need to have tools that can detect and visualize national-level outages. It also puts the outage into context: we can see a few other outages in Uruguay, Brazil, and Saudi Arabia.
This analysis uses dataset usc-lander /internet_outage_adaptive_a17all-20140701, available for research use from PREDICT, or by request from us if PREDICT access is not possible.
This animation was first shown at the Dec. 2014 DHS Cyber Security Division R&D Showcase and Technical Workshop as part of the talk “Towards Understanding Internet Reliability” given by John Heidemann. This work was supported by DHS, most recently through the LACREND project.
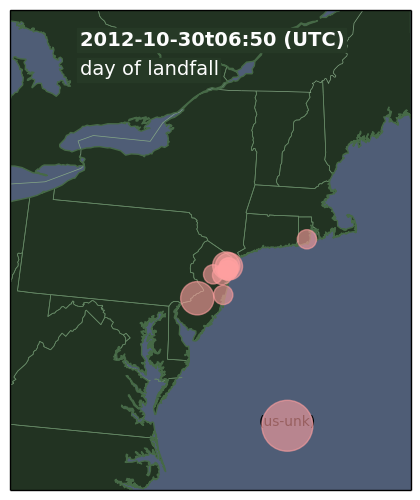
In October 2012, Hurricane Sandy made landfall on the U.S. East Coast causing widespread power outages. We were able to see the effects of Hurricane Sandy by analyzing active probing of the Internet. We first reported this work in a technical report and then with more refined analysis in a peer-reviewed paper.
Network outages for a sample of U.s. East Coast networks on the day after Hurricane Sandy made landfall.
These 4 days before landfall and 7 after show some intersting results: On the day of landfall we see about three-times the number of outages relative to “typical” U.S. networks. Finally, we see it takes about four days to recover back to typical conditions.
This analysis uses dataset usc-lander / internet_address_survey_reprobing_it50j, available for research use from PREDICT, or by request from us if PREDICT access is not possible.
This animation was first shown at the Dec. 2014 DHS Cyber Security Division R&D Showcase and Technical Workshop as part of the talk “Towards Understanding Internet Reliability” given by John Heidemann. This work was supported by DHS, most recently through the LACREND project.
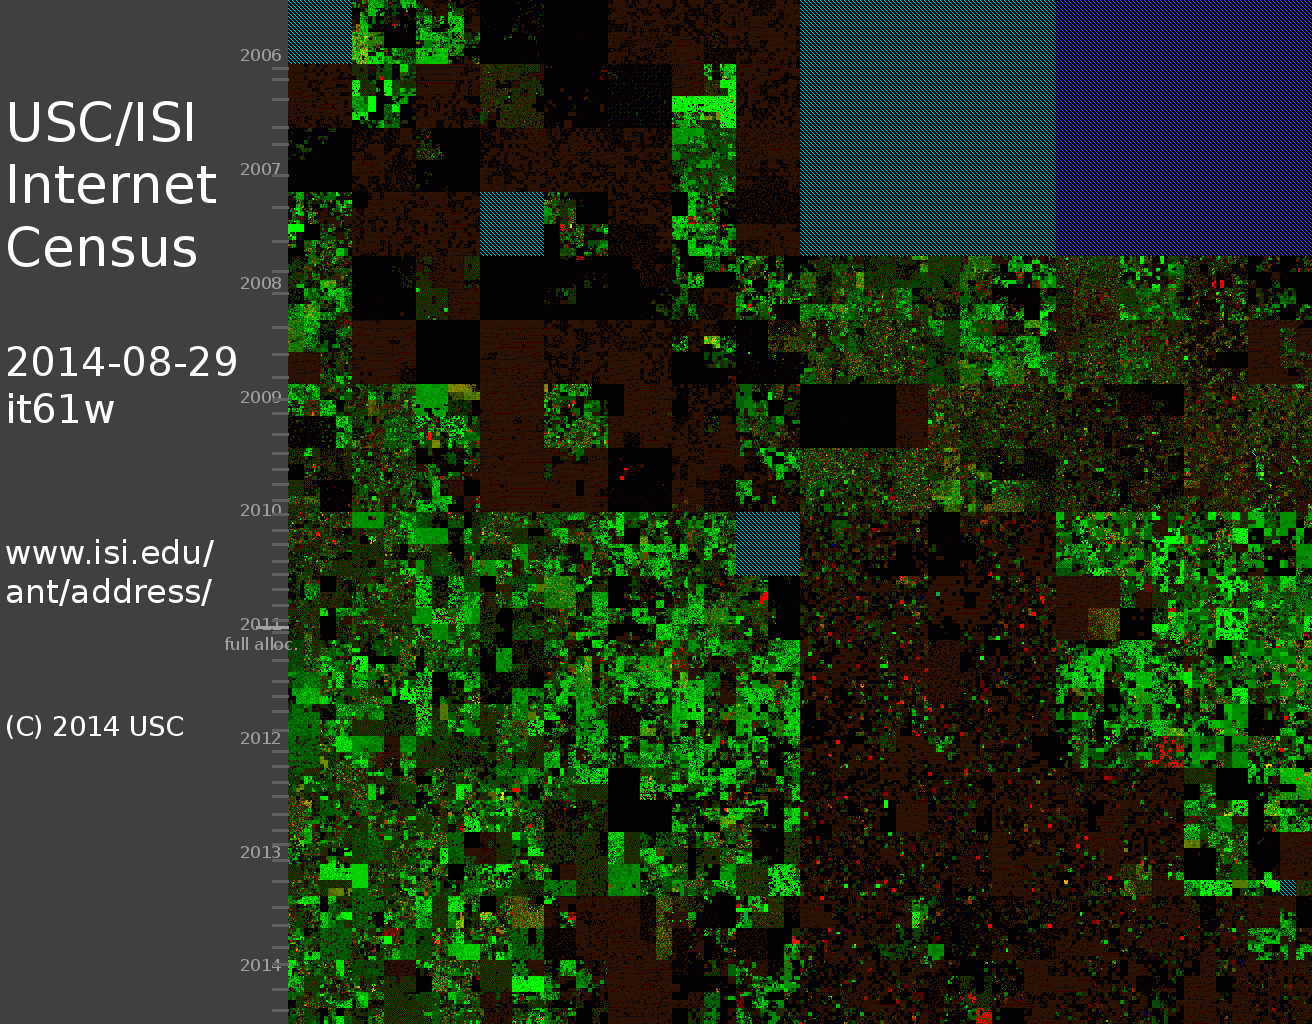
We’ve been taking Internet IPv4 censuses regularly since 2006. In each census, we probe the entire allocated IPv4 address space. You may browse 8 years of data at our IPv4 address browser.
A still image from our animation of 8 years of IPv4 censuses.
These eight years show some interesting events, from an early “open” Internet in 2006, to full allocation of IPv4 by ICANN in 2011, to higher utilization in 2014.
This animation was first shown at the Dec. 2014 DHS Cyber Security Division R&D Showcase and Technical Workshop as part of the talk “Towards Understanding Internet Reliability” given by John Heidemann. This work was supported by DHS, most recently through the LACREND project.
John Heidemann gave the talk “Internet Populations (Good and Bad): Measurement, Estimation, and Correlation” at the ICERM Workshop on Cybersecurity at Brown University, Providence, Rhode Island on October 22, 2014. Slides are available at http://www.isi.edu/~johnh/PAPERS/Heidemann14e/.
Can we improve the mathematical tools we use to measure and understand the Internet?
From the abstract:
Our research studies the Internet’s public face. Since 2006 we have been taking censuses of the Internet address space (pinging all IPv4 addresses) every 3 months. Since 2012 we have studied network outages and events like Hurricane Sandy, using probes of much of the Internet every 11 minutes. Most recently we have evaluated the diurnal Internet, finding countries where most people turn off their computers at night. Finally, we have looked at network reputation, identifying how spam generation correlates with network location, and others have studies multiple measurements of “network reputation”.
A common theme across this work is one must estimate characteristics of the edge of the Internet in spite of noisy measurements and a underlying changes. One also need to compare and correlate these imperfect measurements with other factors (from GDP to telecommunications policies).
How do these applications relate to the mathematics of census taking and measurement, estimation, and correlation? Are there tools we should be using that we aren’t? Do the properties of the Internet suggest new approaches (for example where rapid full enumeration is possible)? Does correlation and estimates of network “badness” help us improve cybersecurity by treating different parts of the network differently?
We have recently put together a video showing 35 days of Internet address usage as observed from Trinocular, our outage detection system.
The Internet sleeps: address use in South America is low (blue) in the early morning, while India is high (red) in afternoon.
The Internet sleeps: address use in South America is low (blue) in the early morning, while India is high (red) in afternoon. When we look at address usage over time, we see that some parts of the globe have daily swings of +/-10% to 20% in the number of active addresses. In China, India, eastern Europe and much of South America, the Internet sleeps.
Understanding when the Internet sleeps is important to understand how different country’s network policies affect use, it is part of outage detection, and it is a piece of improving our long-term goal of understanding exactly how big the Internet is.
This work is partly supported by DHS S&T, Cyber Security division, agreement FA8750-12-2-0344 (under AFRL) and N66001-13-C-3001 (under SPAWAR). The views contained
herein are those of the authors and do not necessarily represent those of DHS or the U.S. Government. This work was classified by USC’s IRB as non-human subjects research (IIR00001648).
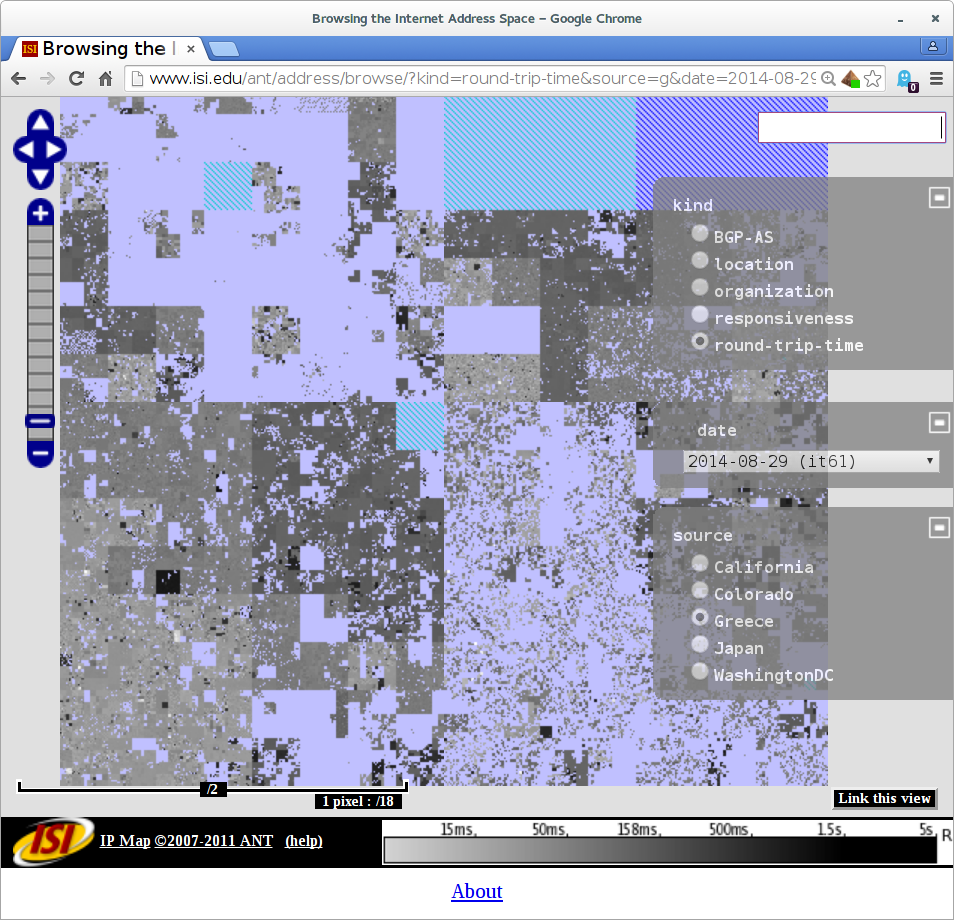
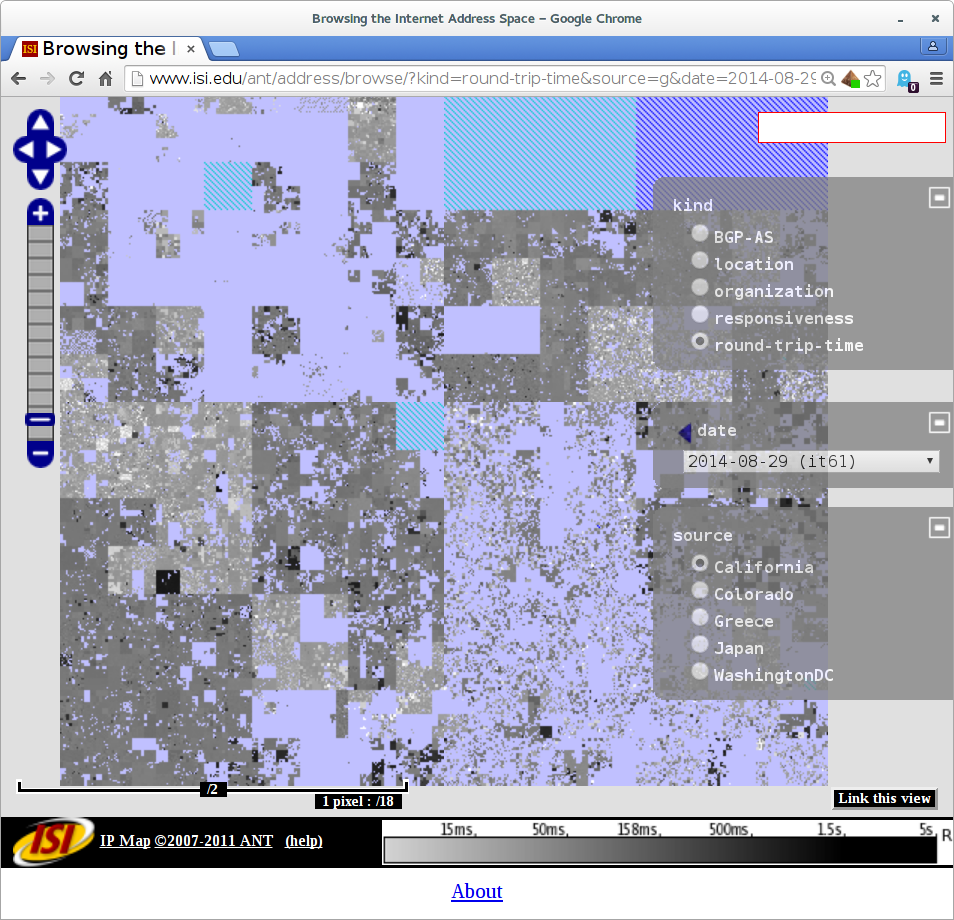
The differences in the census are small, as one would hope, since it’s a global Internet. However, when we look at latency (the time it takes for an IP address to reply to our requests), Greece gives us a European view.
Compare the lower-left corner of the Internet, since that is European IPv4 address space:
Round-trip times from our Greek vantage point (in AUEB.gr) to the world. Observe that European IP addresses in the lower left corner are nearby (light colored).Round-trip times from our Los Angeles-based vantage point (at isi.edu) to the world. Observe that European IP addresses in the lower left corner are distant (darker gray).
In addition to big thanks to George Xylomenos and George Polyzos of AUEB (σας ευχαριστώ!) and AUEB for institutional funding for this work. We also thank Christos Papadopoulos (Colorado State) for helping with many details, and Colin Perkins (U. Glasgow) for discussions about potential European hosts.
Data from our Greece census is available to researchers at no cost on the same terms as our existing census data. See our datasets page for details. Greek data starts with it61 as of 2014-08-29.