The PAM 2017 best paper award for “Anycast Latency: How Many Sites Are Enough?”
Congratulations to Ricardo de Oliveira Schmidt (U. Twente), John Heidemann (USC/ISI), and Jan Harm Kuipers (U. Twente) for the award of best paper at the Conference on Passive and Active Measurement (PAM) 2017 to their paper “Anycast Latency: How Many Sites Are Enough?”.
The paper “Anycast Latency: How Many Sites Are Enough?” will appear at PAM 2017, the Conference on Passive and Active Measurement in March 2017 in Sydney, Australia (available at http://www.isi.edu/~johnh/PAPERS/Schmidt17a.pdf)
Update 2017-03-31: This paper was awarded Best Paper at PAM 2017.
Median RTT (with quartiles as error bars) for countries with at least 5 vantage points for L-Root in 2015. Even more than 100 anycast sites, L still has relatively high latency in some countries in Africa and Asia.
From the abstract:
Anycast is widely used today to provide important services such as DNS and Content Delivery Networks (CDNs). An anycast service uses multiple sites to provide high availability, capacity and redundancy. BGP routing associates users to sites, defining the catchment that each site serves. Although prior work has studied how users associate with anycast services informally, in this paper we examine the key question how many anycast sites are needed to provide good latency, and the worst case latencies that specific deployments see. To answer this question, we first define the optimal performance that is possible, then explore how routing, specific anycast policies, and site location affect performance. We develop a new method capable of determining optimal performance and use it to study four real-world anycast services operated by different organizations: C-, F-, K-, and L-Root, each part of the Root DNS service. We measure their performance from more than 7,900 vantage points (VPs) worldwide using RIPE Atlas. (Given the VPs uneven geographic distribution, we evaluate and control for potential bias.) Our key results show that a few sites can provide performance nearly as good as many, and that geographic location and good connectivity have a far stronger effect on latency than having many sites. We show how often users see the closest anycast site, and how strongly routing policy affects site selection.
This paper is joint work of Ricardo de Oliveira Schmidt, John Heidemann (USC/ISI), and Jan Harm Kuipers (U. Twente). Datasets in this paper are derived from RIPE Atlas and are available at http://traces.simpleweb.org/ and at https://ant.isi.edu/datasets/anycast/.
Comparing actual (obtained) anycast latency against optimal possible anycast latency, for 4 different anycast deployments (each a Root Letter). From the talk [Heidemann16b], based on data from [Moura16b].From the abstract:
This talk will evaluate anycast latency. An anycast service uses multiple sites to provide high availability, capacity and redundancy, with BGP routing associating users to nearby anycast sites. Routing defines the catchment of the users that each site serves. Although prior work has studied how users associate with anycast services informally, in this paper we examine the key question how many anycast sites are needed to provide good latency, and the worst case latencies that specific deployments see. To answer this question, we must first define the optimal performance that is possible, then explore how routing, specific anycast policies, and site location affect performance. We develop a new method capable of determining optimal performance and use it to study four real-world anycast services operated by different organizations: C-, F-, K-, and L-Root, each part of the Root DNS service. We measure their performance from more than worldwide vantage points (VPs) in RIPE Atlas. (Given the VPs uneven geographic distribution, we evaluate and control for potential bias.) Key results of our study are to show that a few sites can provide performance nearly as good as many, and that geographic location and good connectivity have a far stronger effect on latency than having many nodes. We show how often users see the closest anycast site, and how strongly routing policy affects site selection.
[Schmidt16a] figure 4: distribution of measured latency (solid lines) to optimal possible latency (dashed lines) for 4 Root DNS anycast deployments.From the abstract:
Anycast is widely used today to provide important services including naming and content, with DNS and Content Delivery Networks (CDNs). An anycast service uses multiple sites to provide high availability, capacity and redundancy, with BGP routing associating users to nearby anycast sites. Routing defines the catchment of the users that each site serves. Although prior work has studied how users associate with anycast services informally, in this paper we examine the key question how many anycast sites are needed to provide good latency, and the worst case latencies that specific deployments see. To answer this question, we must first define the optimal performance that is possible, then explore how routing, specific anycast policies, and site location affect performance. We develop a new method capable of determining optimal performance and use it to study four real-world anycast services operated by different organizations: C-, F-, K-, and L-Root, each part of the Root DNS service. We measure their performance from more than worldwide vantage points (VPs) in RIPE Atlas. (Given the VPs uneven geographic distribution, we evaluate and control for potential bias.) Key results of our study are to show that a few sites can provide performance nearly as good as many, and that geographic location and good connectivity have a far stronger effect on latency than having many nodes. We show how often users see the closest anycast site, and how strongly routing policy affects site selection.
This technical report is joint work of Ricardo de O. Schmidt and Jan Harm Kuipers (U. Twente) and John Heidemann (USC/ISI). Datasets in this paper are derived from RIPE Atlas and are available at http://traces.simpleweb.org/.
The differences in the census are small, as one would hope, since it’s a global Internet. However, when we look at latency (the time it takes for an IP address to reply to our requests), Greece gives us a European view.
Compare the lower-left corner of the Internet, since that is European IPv4 address space:
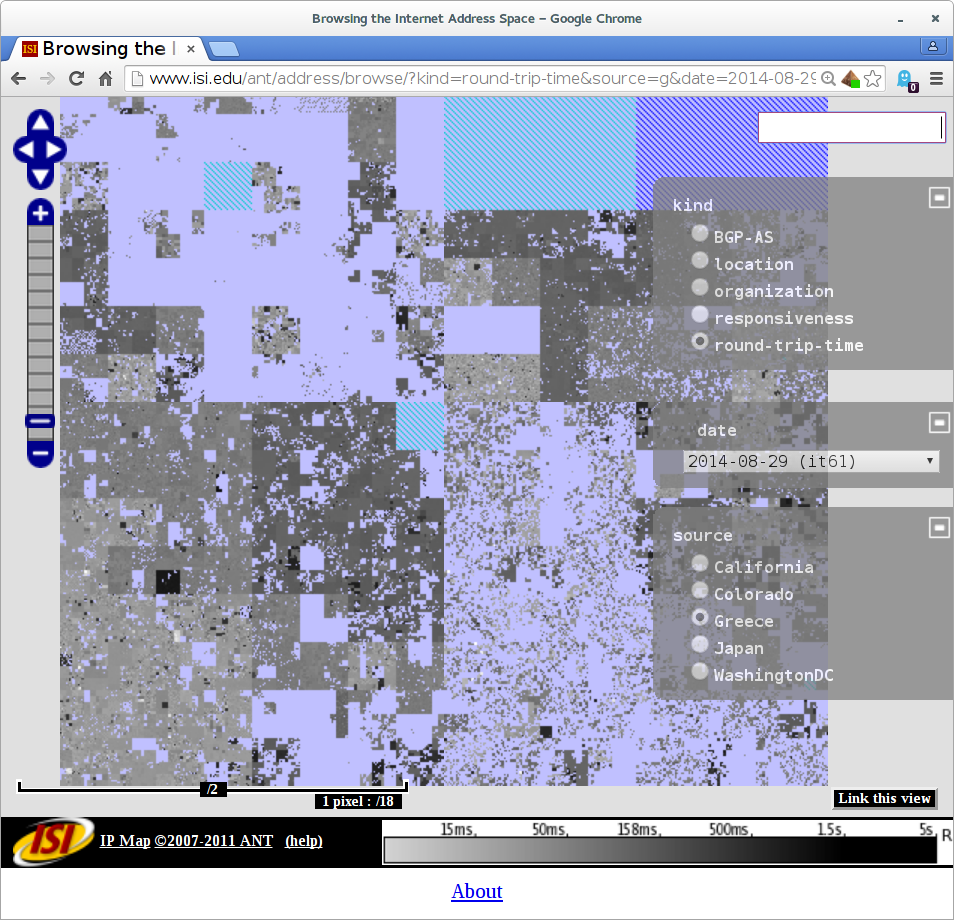
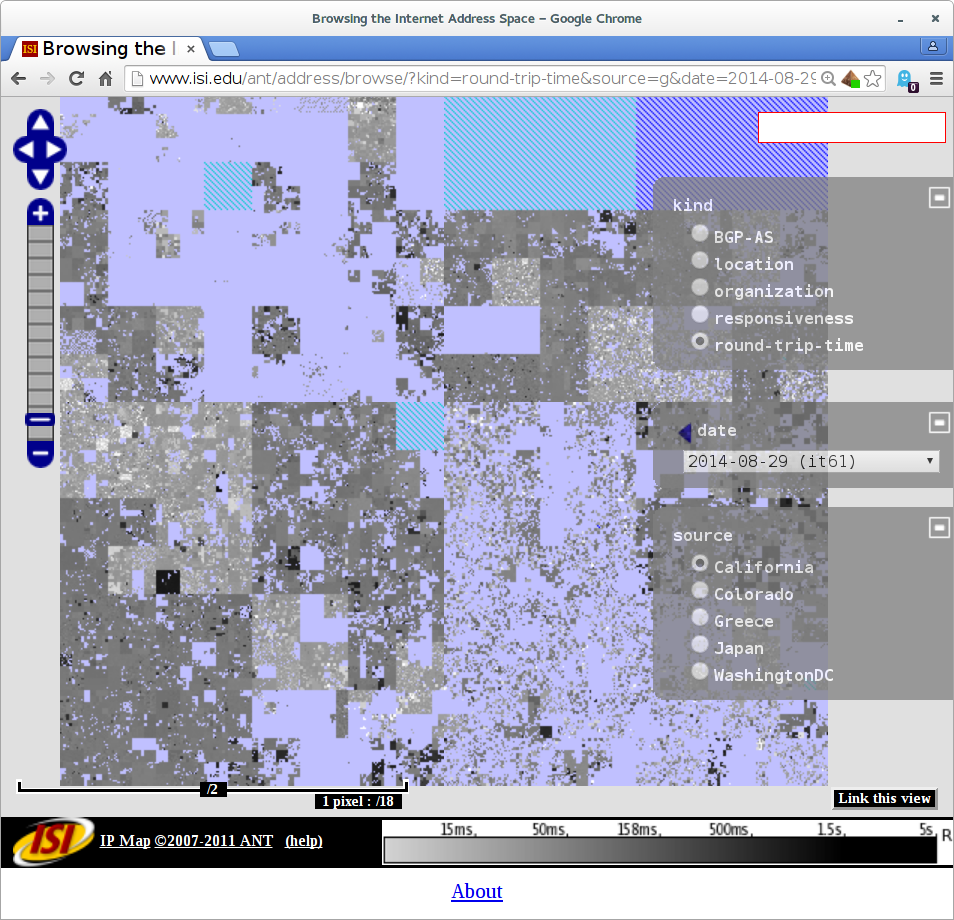
Round-trip times from our Greek vantage point (in AUEB.gr) to the world. Observe that European IP addresses in the lower left corner are nearby (light colored).Round-trip times from our Los Angeles-based vantage point (at isi.edu) to the world. Observe that European IP addresses in the lower left corner are distant (darker gray).
In addition to big thanks to George Xylomenos and George Polyzos of AUEB (σας ευχαριστώ!) and AUEB for institutional funding for this work. We also thank Christos Papadopoulos (Colorado State) for helping with many details, and Colin Perkins (U. Glasgow) for discussions about potential European hosts.
Data from our Greece census is available to researchers at no cost on the same terms as our existing census data. See our datasets page for details. Greek data starts with it61 as of 2014-08-29.
Although the Internet is widely used today, we have little information about the edge of the network. Decentralized management, firewalls, and sensitivity to probing prevent easy answers and make measurement difficult. Building on frequent ICMP probing of 1% of the Internet address space, we develop clustering and analysis methods to estimate how Internet addresses are used. We show that adjacent addresses often have similar characteristics and are used for similar purposes (61% of addresses we probe are consistent blocks of 64 neighbors or more). We then apply this block-level clustering to provide data to explore several open questions in how networks are managed. First, we provide information about how effectively network address blocks appear to be used, finding that a significant number of blocks are only lightly used (most addresses in about one-fifth of /24 blocks are in use less than 10% of the time), an important issue as the IPv4 address space nears full allocation. Second, we provide new measurements about dynamically managed address space, showing nearly 40% of /24 blocks appear to be dynamically allocated, and dynamic addressing is most widely used in countries more recent to the Internet (more than 80% in China, while less than 30% in the U.S.). Third, we distinguish blocks with low-bitrate last-hops and show that such blocks are often underutilized.
Citation: Xue Cai and John Heidemann. Understanding Block-level Address Usage in the Visible Internet. In Proceedings of the ACM SIGCOMM Conference , p. to appear. New Delhi, India, ACM. August, 2010. <http://www.isi.edu/~johnh/PAPERS/Cai10a.html>.
We’re happy to announce an update to our browsable Internet map at http://www.isi.edu/ant/address/browse/. Our map now includes FIND ME and MULTIPLE VIEWS.
screenshot of browsing RTTs in the Internet
FIND ME: To locate any host on the map, click in the IP address address box (at the top right) and type in a hostname. A pushpin will appear at that address, with a bubble indicating the hostname and IP address, and the map will scroll to the location. No more manually finding addresses!
MULTIPLE VIEWS allow users to flip between different data types, census dates, source locations:
DATA TYPES: We now plot round-trip times in addition to prior ping responsiveness. See how far away the Internet is! (At least from our probing sites.)
CENSUS DATES: We currently plot five datasets from Nov 2006 to June 2009. Travel through time to see the Internet of yesteryear!
SOURCE LOCATIONS: We collect data from two different locations: Los Angeles and Colorado State University, to help understand if we have observation bias. See the Internet from sea level, or a mile high!
To select different views, click the +-sign on the right of the screen and pick from the menus.

![[Schmidt16a] figure 4: distribution of measured latency (solid lines) to optimal possible latency (dashed lines) for 4 Root DNS anycast deployments.](https://ant.isi.edu/blog/wp-content/uploads/2016/05/plot-cdf-optimal.png)