We have released a new technical report “Improving the Optics of the Active Outage Detection (extended)”, by Guillermo Baltra and John Heidemann, as ISI-TR-733.
From the abstract:
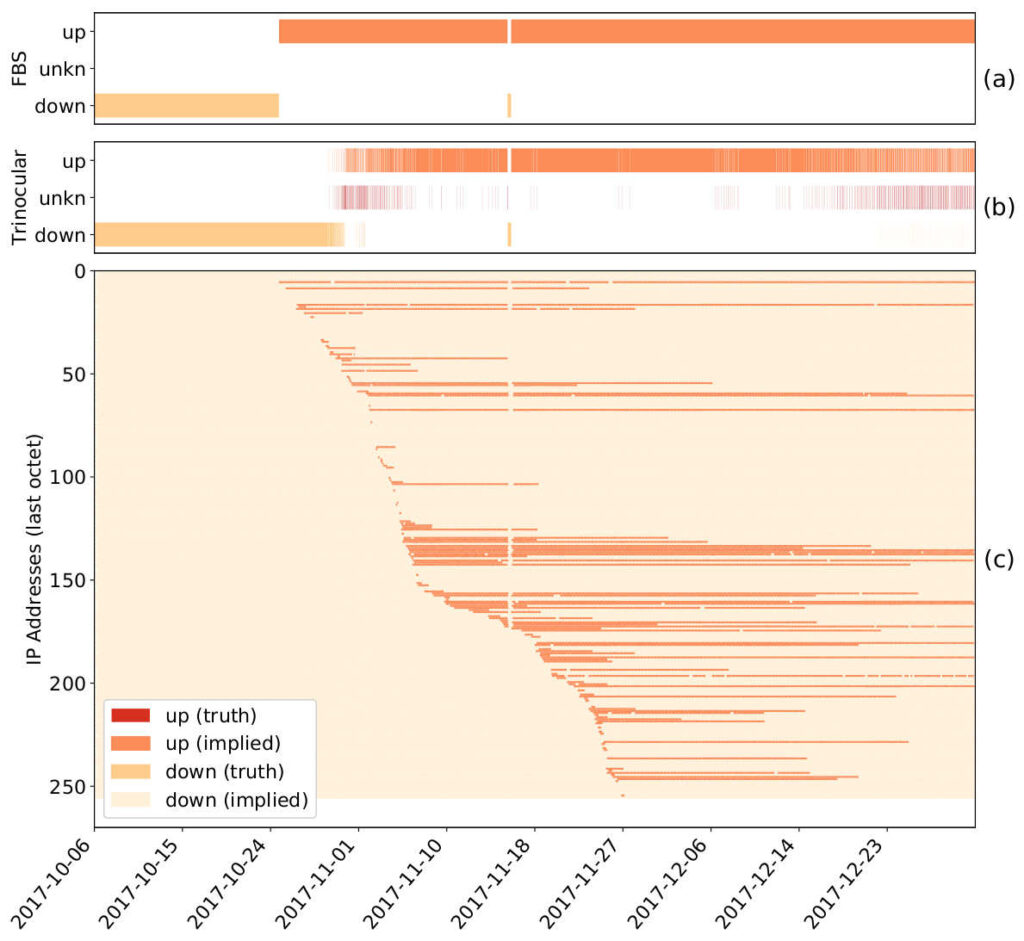
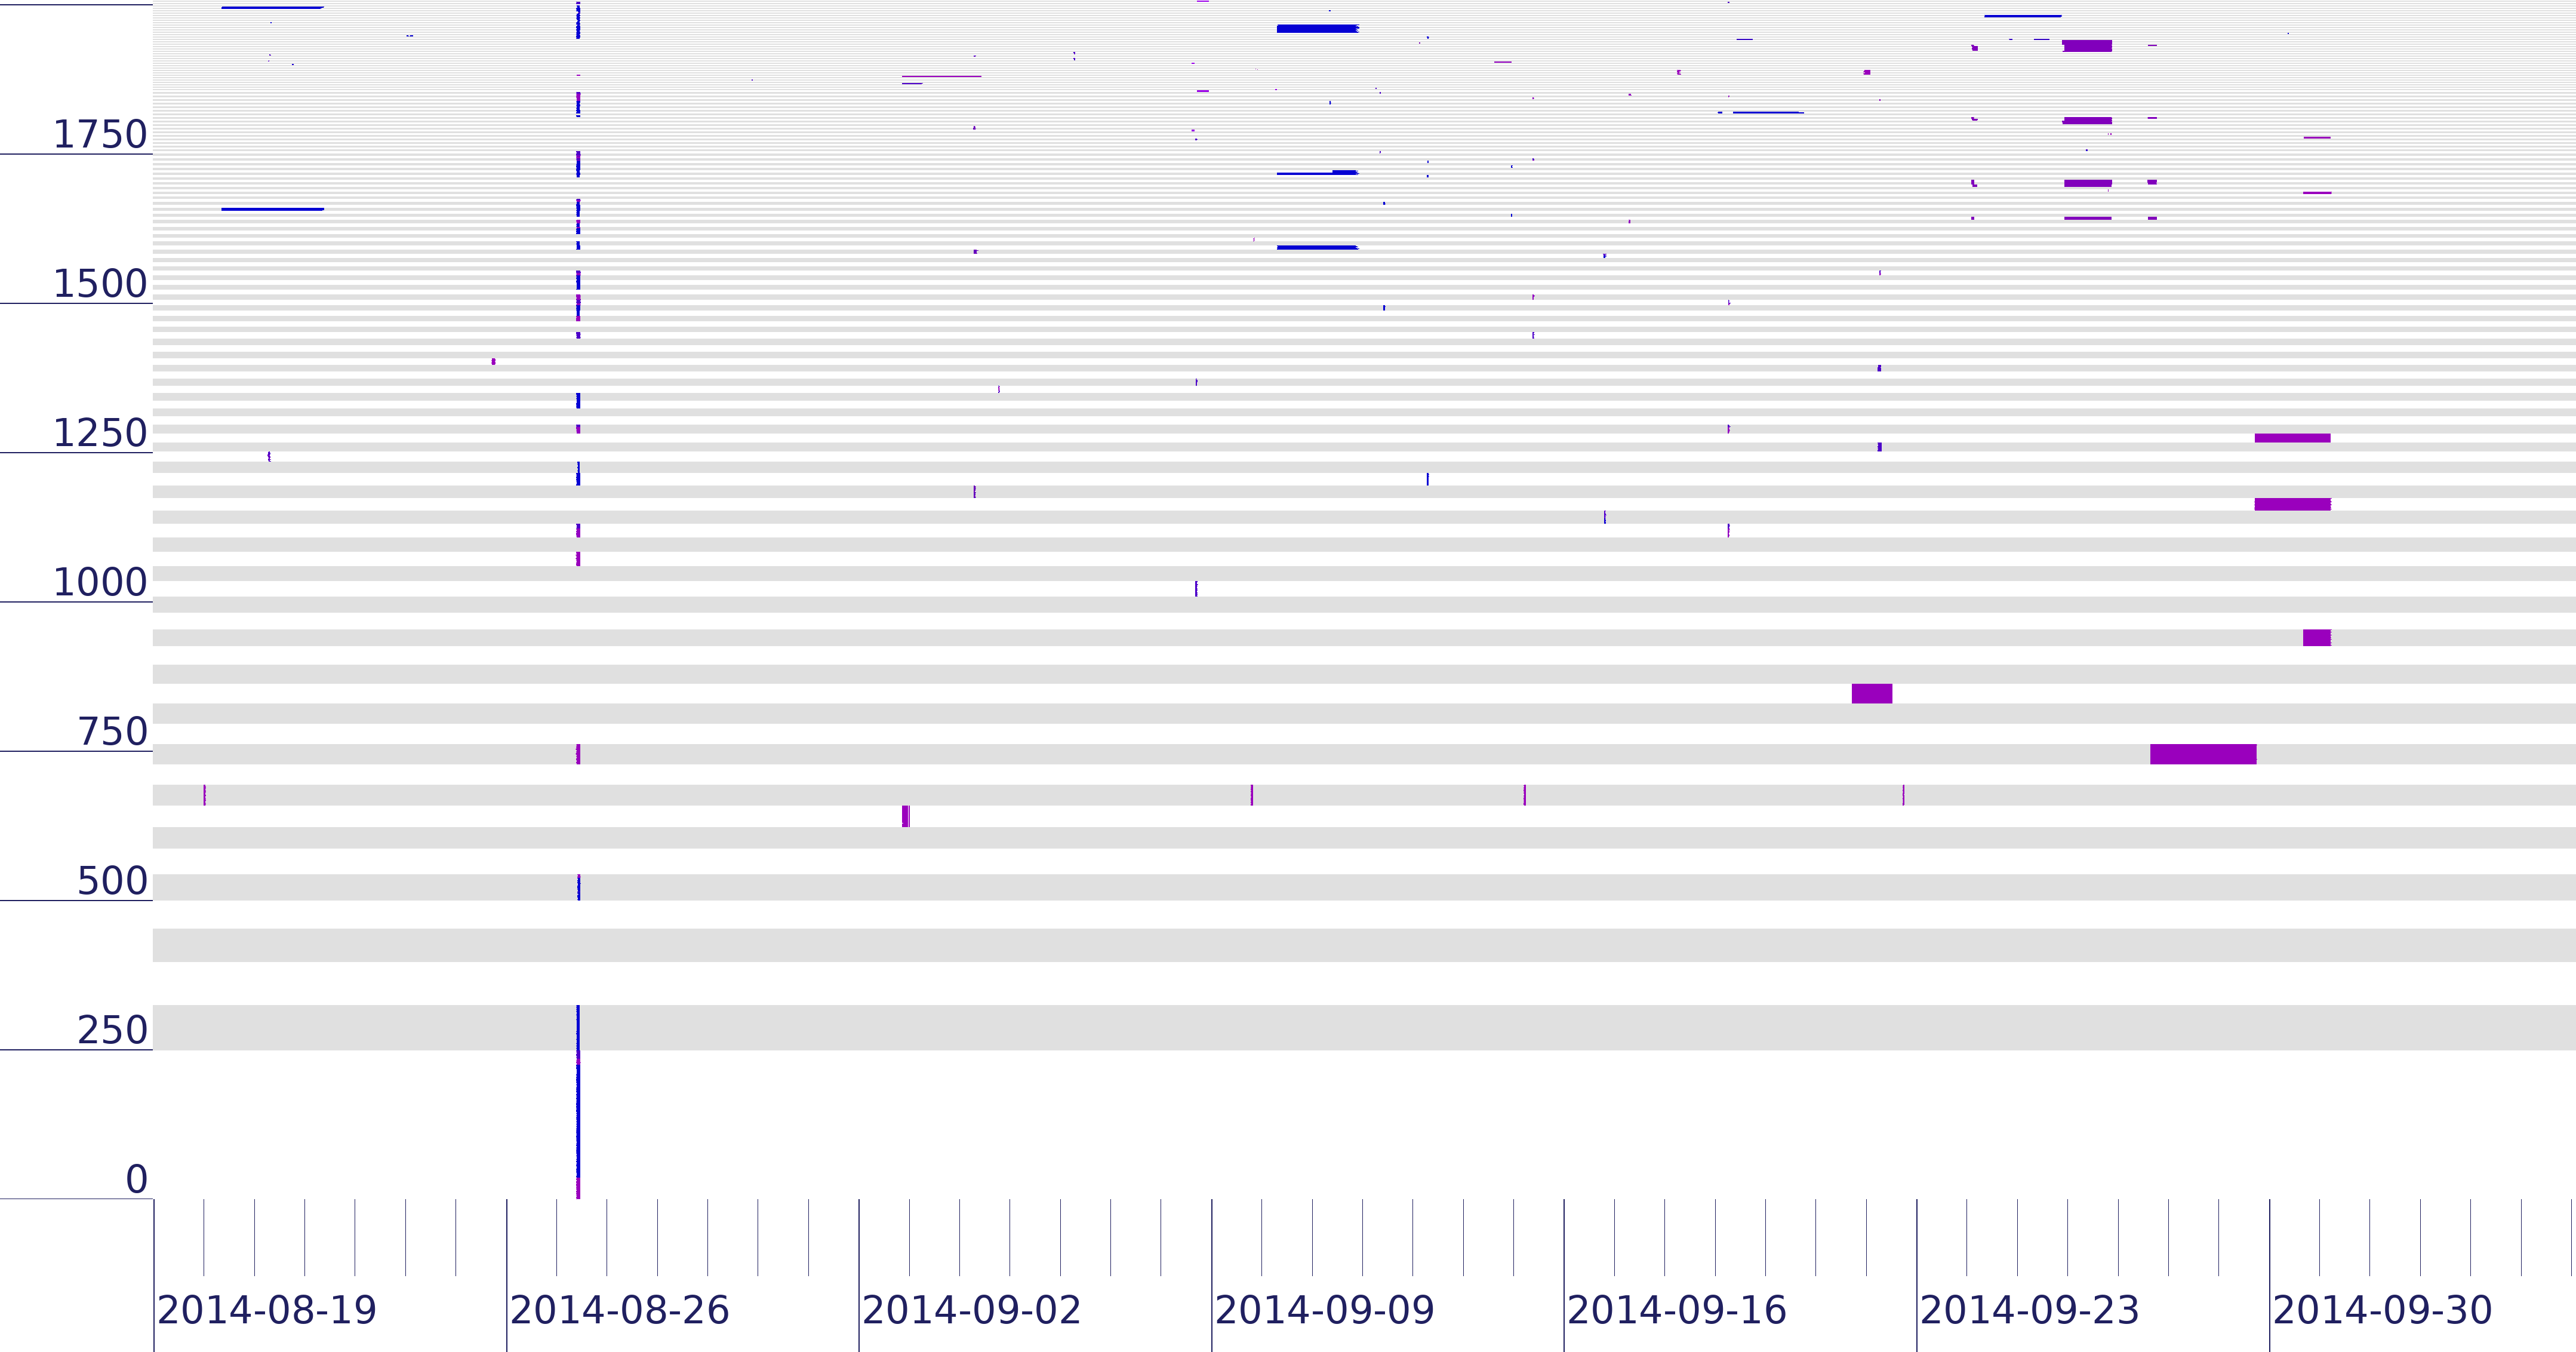
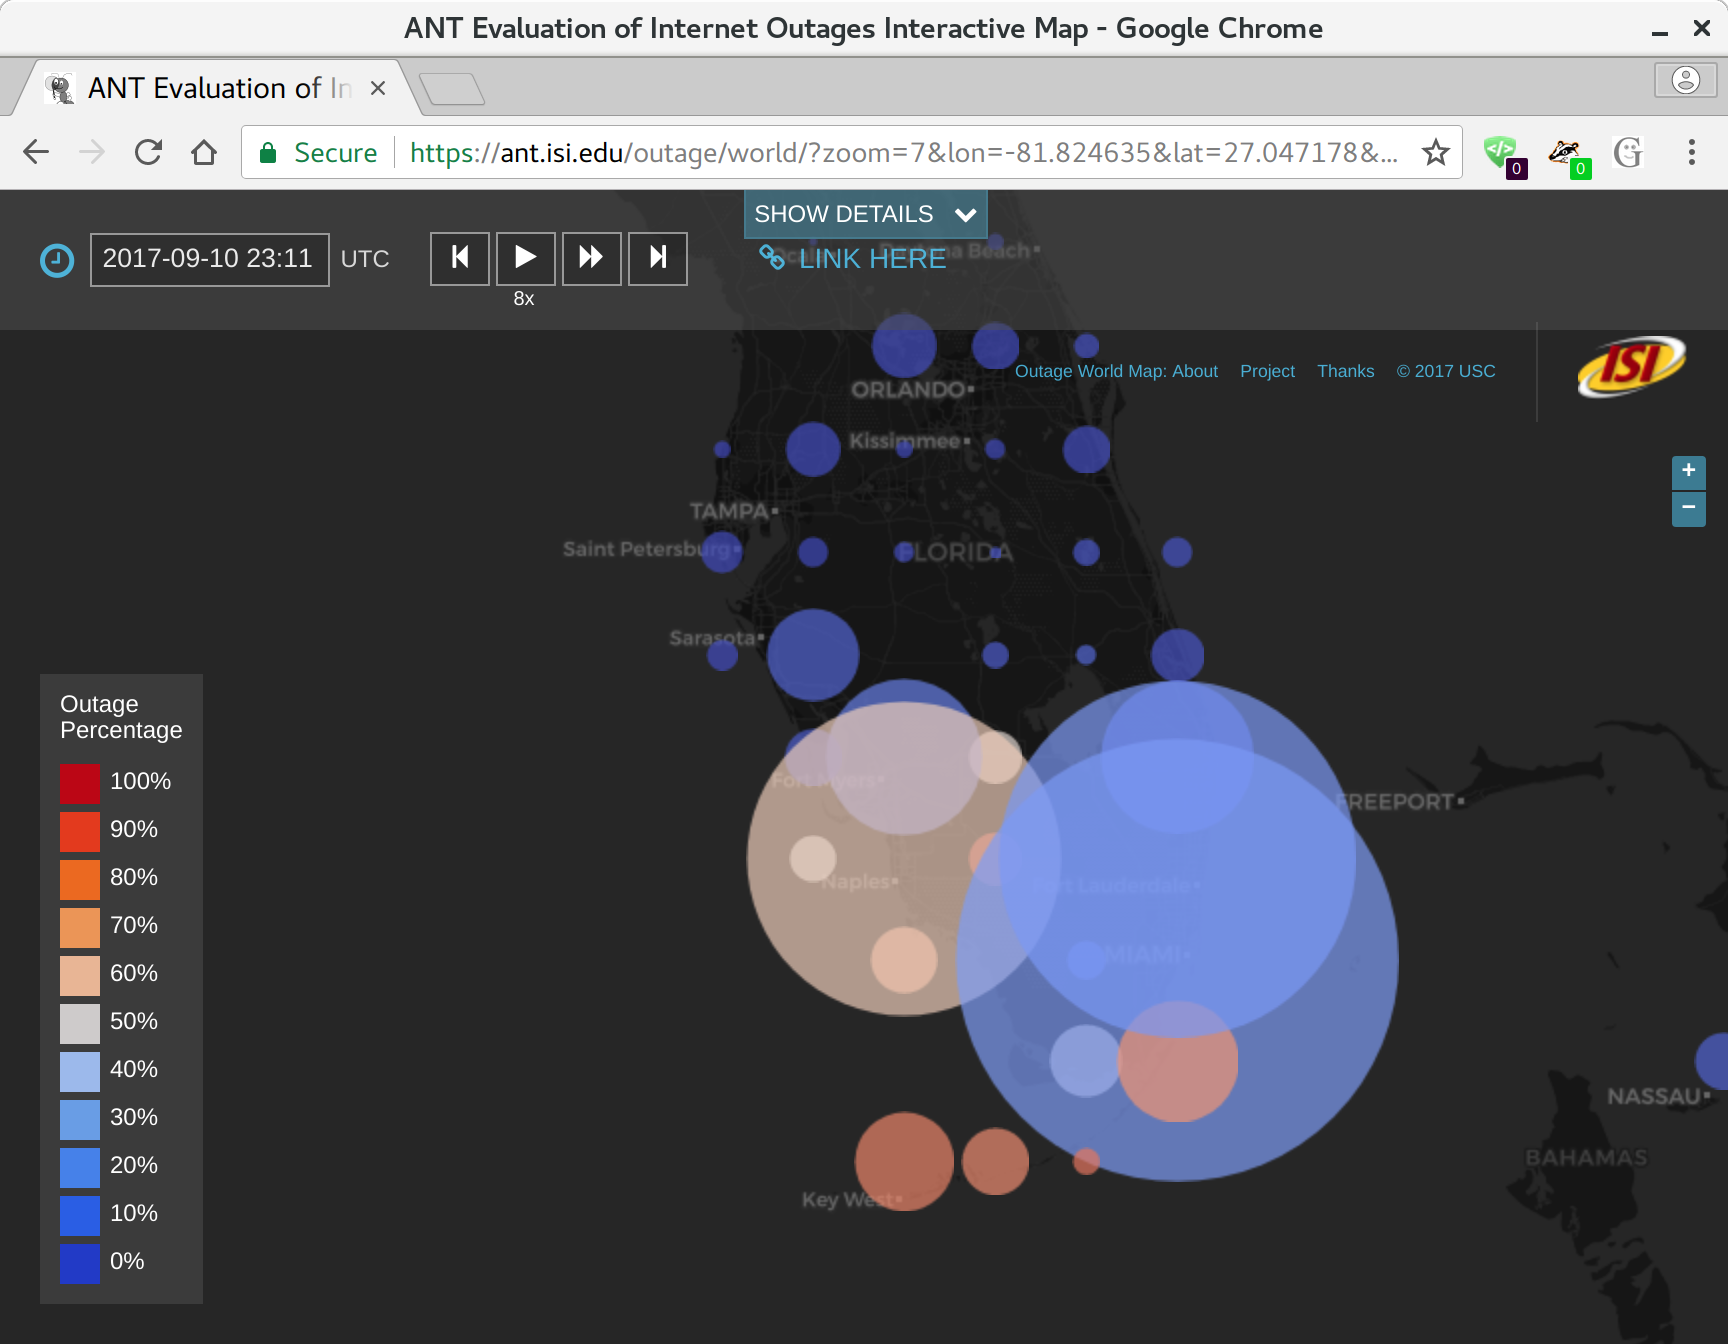
There is a growing interest in carefully observing the reliability of the Internet’s edge. Outage information can inform our understanding of Internet reliability and planning, and it can help guide operations. Outage detection algorithms using active probing from third parties have been shown to be accurate for most of the Internet, but inaccurate for blocks that are sparsely occupied. Our contributions include a definition of outages, which we use to determine how many independent observers are required to determine global outages. We propose a new Full Block Scanning (FBS) algorithm that gathers more information for sparse blocks to reduce false outage reports. We also propose ISP Availability Sensing (IAS) to detect maintenance activity using only external information. We study a year of outage data and show that FBS has a True Positive Rate of 86%, and show that IAS detects maintenance events in a large U.S. ISP.
All data from this paper will be publicly available.