Categories
Presentations

new animation: eight years of Internet IPv4 Censuses

We’ve been taking Internet IPv4 censuses regularly since 2006.  In each census, we probe the entire allocated IPv4 address space.  You may browse 8 years of data at our IPv4 address browser.

A still image from our animation of 8 years of IPv4 censuses.

We recently put together an animation showing 8 years of IPv4 censuses, from 2006 through 2014.

These eight years show some interesting events, from an early “open” Internet in 2006, to full allocation of IPv4 by ICANN in 2011, to higher utilization in 2014.

All data shown here can be browsed at our website.
Data is available for research use from PREDICT or by request from us if PREDICT access is not possible.

This animation was first shown at the Dec. 2014 DHS Cyber Security Division R&D Showcase and Technical Workshop as part of the talk “Towards Understanding Internet Reliability” given by John Heidemann.  This work was supported by DHS, most recently through the LACREND project.

Categories
Presentations

new animation “Watching the Internet Sleep”

Does the Internet sleep? Yes, and we have the video!

We have recently put together a video showing 35 days of Internet address usage as observed from Trinocular, our outage detection system.

The Internet sleeps: address use in South America is low (blue) in the early morning, while India is high (red) in afternoon.

The Internet sleeps: address use in South America is low (blue) in the early morning, while India is high (red) in afternoon.  When we look at address usage over time, we see that some parts of the globe have daily swings of +/-10% to 20% in the number of active addresses. In China, India, eastern Europe and much of South America, the Internet sleeps.

Understanding when the Internet sleeps is important to understand how different country’s network policies affect use, it is part of outage detection, and it is a piece of improving our long-term goal of understanding exactly how big the Internet is.

See http://www.isi.edu/ant/diurnal/ for the video, or read our technical paper “When the Internet Sleeps: Correlating Diurnal Networks With External Factors” by Quan, Heidemann, and Pradkin, to appear at ACM IMC, Nov. 2014.

Datasets (listed here) used in generating this video are available.

This work is partly supported by DHS S&T, Cyber Security division, agreement FA8750-12-2-0344 (under AFRL) and N66001-13-C-3001 (under SPAWAR).  The views contained
herein are those of the authors and do not necessarily represent those of DHS or the U.S. Government.  This work was classified by USC’s IRB as non-human subjects research (IIR00001648).

Categories
Announcements Collaborations Data Internet Outages

welcoming Greece to the ANT Internet Census

We’re happy to welcome Greece to our browsable Internet map at http://www.isi.edu/ant/address/browse/ !  Of course Greece has always been in our Internet censuses, but George Xylomenos and George Polyzos of the Athens University of Economics and Business (their lab) helped set up a new observation site.  Greece now provides a new vantage point for Internet censuses.

The differences in the census are small, as one would hope, since it’s a global Internet.  However, when we look at latency (the time it takes for an IP address to reply to our requests), Greece gives us a European view.

Compare the lower-left corner of the Internet, since that is European IPv4 address space:

it61g RTTs
Round-trip times from our Greek vantage point (in AUEB.gr) to the world. Observe that European IP addresses in the lower left corner are nearby (light colored).
it61w RTTs
Round-trip times from our Los Angeles-based vantage point (at isi.edu) to the world. Observe that European IP addresses in the lower left corner are distant (darker gray).

In addition to big thanks to George Xylomenos and George Polyzos of AUEB (σας ευχαριστώ!) and AUEB for institutional funding for this work.  We also thank Christos Papadopoulos (Colorado State) for helping with many details, and Colin Perkins (U. Glasgow) for discussions about potential European hosts.

Data from our Greece census is available to researchers at no cost on the same terms as our existing census data.  See our datasets page for details. Greek data starts with it61 as of 2014-08-29.

Categories
Papers Publications

new conference paper “When the Internet Sleeps: Correlating Diurnal Networks With External Factors” in IMC 2014

The paper “When the Internet Sleeps: Correlating Diurnal Networks With External Factors” will appear at ACM Internet Measurements Conference 2014 in Vancouver, Canada (available at http://www.isi.edu/~johnh/PAPERS/Quan14c/ with cite and pdf, or direct pdf).

Predicting longitude from observed diurnal phase ([Quan14c], figure 14c)
Predicting longitude from observed diurnal phase for 287k geolocatable, diurnal blocks ([Quan14c], figure 14c)
From the abstract:

As the Internet matures, policy questions loom larger in its operation. When should an ISP, city, or government invest in infrastructure? How do their policies affect use? In this work, we develop a new approach to evaluate how policies, economic conditions and technology correlates with Internet use around the world. First, we develop an adaptive and accurate approach to estimate block availability, the fraction of active IP addresses in each /24 block over short timescales (every 11 minutes). Our estimator provides a new lens to interpret data taken from existing long-term outage measurements, thus requiring no additional traffic. (If new collection was required, it would be lightweight, since on average, outage detection requires less than 20 probes per hour per /24 block; less than 1% of background radiation.) Second, we show that spectral analysis of this measure can identify diurnal usage: blocks where addresses are regularly used during part of the day and idle in other times. Finally, we analyze data for the entire responsive Internet (3.7M /24 blocks) over 35 days. These global observations show when and where the Internet sleeps—networks are mostly always-on in the US and Western Europe, and diurnal in much of Asia, South America, and Eastern Europe. ANOVA (Analysis of Variance) testing shows that diurnal networks correlate negatively with country GDP and electrical consumption, quantifying that national policies and economics relate to networks.

Citation: Lin Quan, John Heidemann, and Yuri Pradkin. When the Internet Sleeps: Correlating Diurnal Networks With External Factors. In Proceedings of the ACM Internet Measurement Conference, p. to appear. Vancouver, BC, Canada, ACM. November, 2014.

All data in this paper is available to researchers at no cost, and source code to our analysis tools is available on request; see our diurnal datasets webpage.

This work is partly supported by DHS S&T, Cyber Security division, agreement FA8750-12-2-0344 (under AFRL) and N66001-13-C-3001 (under SPAWAR).  The views contained
herein are those of the authors and do not necessarily represent those of DHS or the U.S. Government.  This work was classified by USC’s IRB as non-human subjects research (IIR00001648).

Categories
Presentations

new video “A Retrospective on an Australian Routing Event”

On 2012-02-23, hardware problems in an Australian ISP (Dodo) router caused it to announce many global routes to their ISP (Telstra), and from there to others.

The result: for 45 minutes, millions of Australians lost international Internet connectivity.

While this problem was detected and corrected in less than an hour, this kind of problem can reoccur.

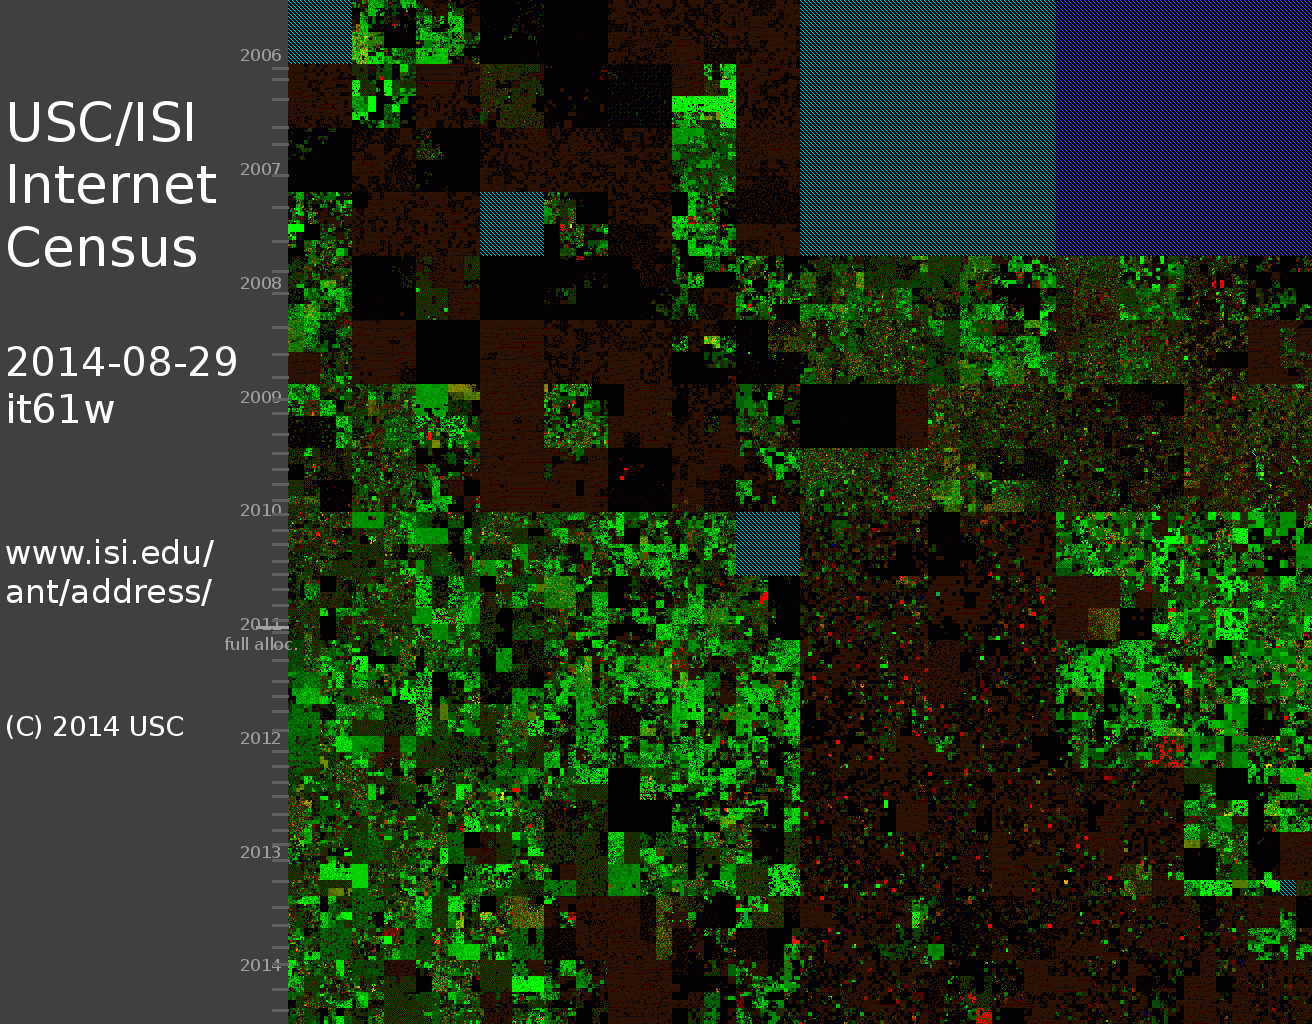
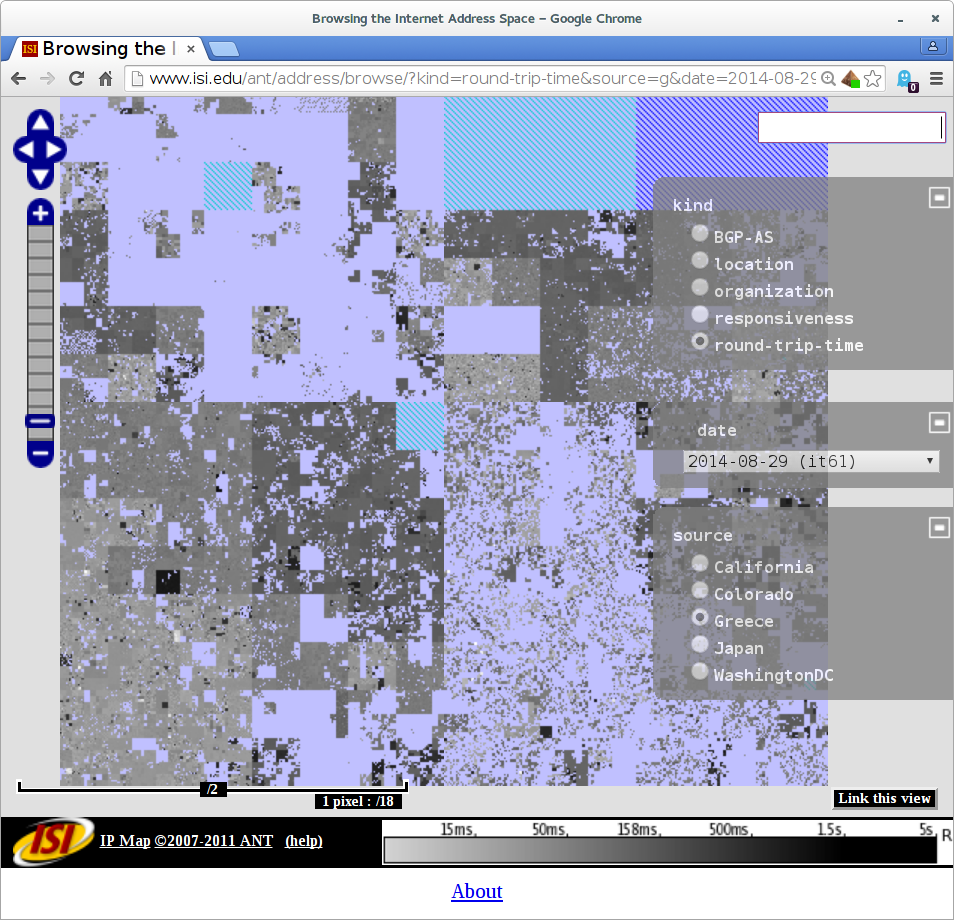
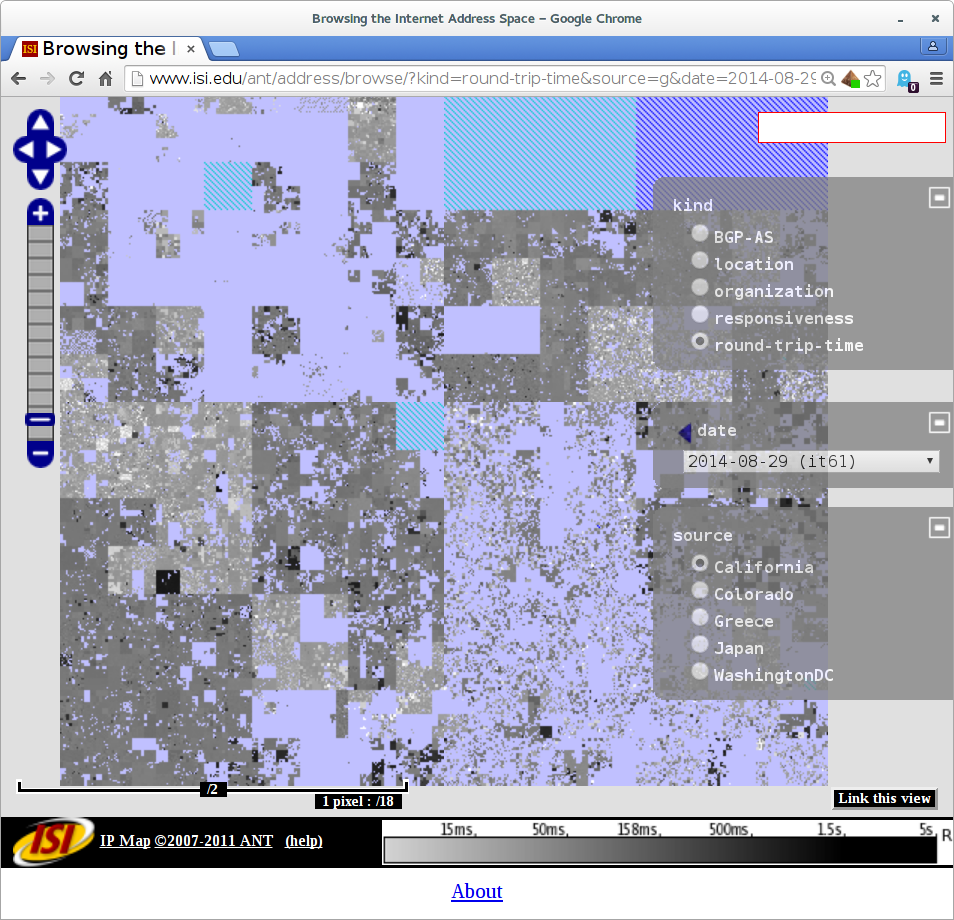
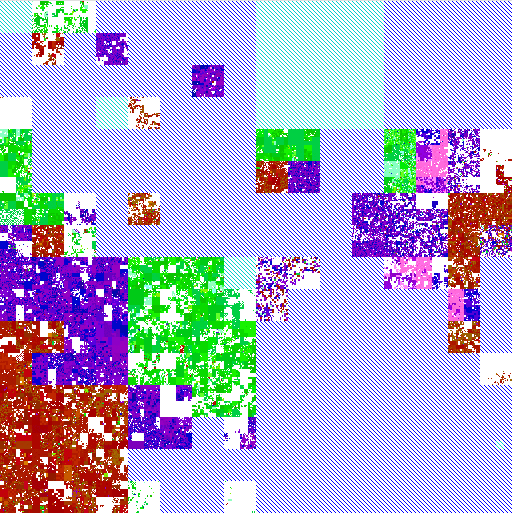
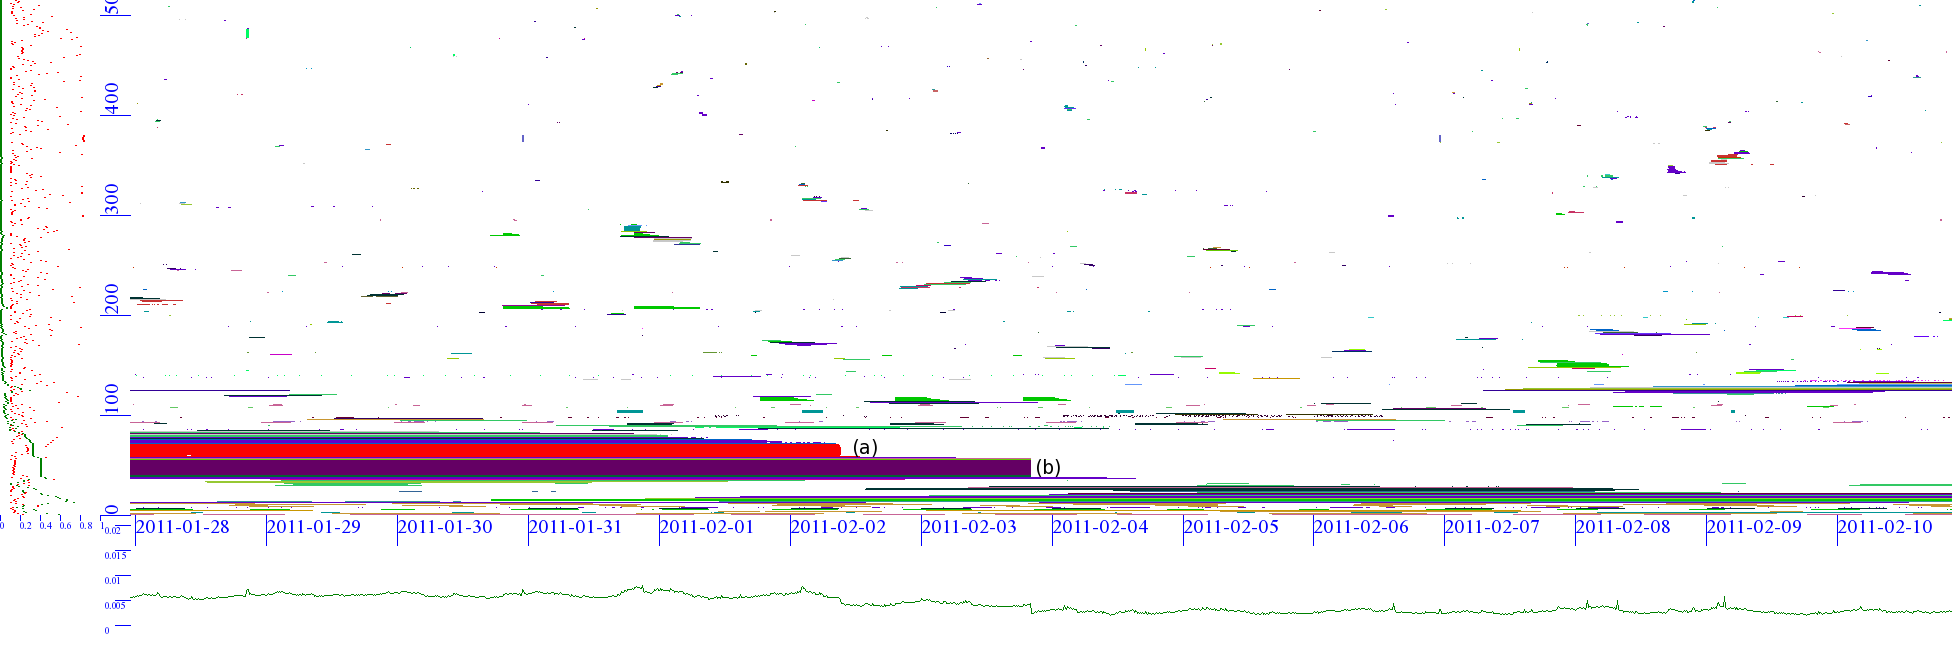
In this video we show the Internet address space (IPv4) from Sydney, Australia.   Colors show estimated physical location (blue: North America, Red: Europe, Green: Asia).   Addresses map to a Hilbert Curve, and nearby addresses form squares.  White boxes show routing changes, with bursts after 02:40 UTC.

In the visualization we see there are many, many routing changes for much of Internet (the many white boxes)–evidence of routing instability in Sydney.

A copy of this video is also available at Vimeo (some system may have problems viewing the above embedded video, but Vimeo is a good alternative).

This video was made by Kaustubh Gadkari, John Heidemann, Cathie Olschanowsky, Christos Papadopoulos, Yuri Pradkin, and Lawrence Weikum at University of Southern California/Information Sciences Institute (USC/ISI) and Colorado State University/Computer Science (CSU).

This video uses software developed at USC/ISI and CSU:  Retro-future Time Travel, the LANDER IPv4 Web Address Browser, and BGPMon, the BGP logging and monitor.  Data from this video is available from BGPMon and PREDICT (or the authors).

This work was supported by DHS S&T (BGPMon, contract N66001-08-C-2028; LANDER, contract D08PC75599, admin. by SPAWAR; LACREND, contract FA8750-12-2-0344, admin. by AFRL; Retro-future, contract N66001-13-C-3001, admin. by SPAWAR), and NSF/CISE (BGPMon, grant CNS-1305404).  Any opinions, findings and conclusions or recommendations expressed in this material are those of the author(s) and do not necessarily reflect the views of funding and administrative agencies.

Categories
Presentations

keynote “Sharing Network Data: Bright Gray Days Ahead” given at Passive and Active Measurement Conference

I’m honored to have been invited to give the keynote talk “Sharing Network Data: Bright Gray Days Ahead” at the Passive and  Active Measurement Conference 2014 in Marina del Rey.

A copy of the talk slides are at http://www.isi.edu/~johnh/PAPERS/Heidemann14b (pdf)

some brighter alternatives
Some alternatives, perhaps brighter than the gray of standard anonymization.

From the talk’s abstract:

Sharing data is what we expect as a community. From the IMC best paper award requiring a public dataset to NSF data management plans, we know that data is crucial to reproducible science. Yet privacy concerns today make data acquisition difficult and sharing harder still. AOL and Netflix have released anonymized datasets that leaked customer information, at least for a few customers and with some effort. With the EU suggesting that IP addresses are personally identifiable information, are we doomed to IP-address free “Internet” datasets?
In this talk I will explore the issues in data sharing, suggesting that we need to move beyond black and white definitions of private and public datasets, to embrace the gray shades of data sharing in our future. Gray need not be gloomy. I will discuss some new ideas in sharing that suggest that, if we move beyond “anonymous ftp” as our definition, the future may be gray but bright.

This talk did not generate new datasets, but it grows out of our experiences distributing data through several research projects (such as LANDER and LACREND, both part of the DHS PREDICT program) mentioned in the talk with data available http://www.isi.edu/ant/traces/.  This talk represents my on opinions, not those of these projects or their sponsors.

Categories
Students

congratulations to Lin Quan for his new PhD

I would like to congratulate Dr. Lin Quan for defending his PhD in Dec. 2013 and his doctoral disseration “Learning about the Internet through Efficient Sampling and Aggregation” in Jan. 2014.

Lin Quan (left) and John Heidemann, after Lin's PhD defense.
Lin Quan (left) and John Heidemann, after Lin’s PhD defense.

From the abstract:

The Internet is important for nearly all aspects of our society, affecting ordinary people, businesses, and social activities. Because of its importance and wide-spread applications, we want to have good knowledge about Internet’s operation, reliability and performance, through various kinds of measurements. However, despite the wide usage, we only have limited knowledge of its overall performance and reliability. The first reason of this limited knowledge is that there is no central governance of the Internet, making both active and passive measurements hard. The second reason is the huge scale of the Internet. This makes brute-force analysis hard because of practical computing resource limits such as CPU, memory and probe rate.

This thesis states that sampling and aggregation are necessary to overcome resource constraints in time and space to learn about better knowledge of the Internet. Many other Internet measurement studies also utilize sampling and aggregation techniques to discover properties of the Internet. We distinguish our work by exploring novel mechanisms and new knowledge in several specific areas. First, we aggregate short-time-scale observations and use an efficient multi-time-scale query scheme to discover the properties and reasons of long-lived Internet flows. Second, we sample and probe /24 blocks in the IPv4 address space, and use greedy clustering algorithms to efficiently characterize Internet outages. Third, we show an efficient and effective aggregation technique by visualization and clustering. This technique makes both manual inspection and automated characterization easier. Last, we develop an adaptive probing system to study global scale Internet reliability. It samples and adapts probe rate within each /24 block for accurate beliefs. By aggregation and correlation to other domains, we are also able to study broader policy effects on Internet use, such as political causes, economic conditions, and access technologies.

This thesis provides several examples of Internet knowledge discovery with new mechanisms of sampling and aggregation techniques. We believe our approaches of new sampling and aggregation mechanisms can be used by and will inspire new ways for future Internet measurement systems to overcome resource constraints, such as large amount and dispersed data.


Categories
Papers Publications

New conference paper “Towards Geolocation of Millions of IP Addresses” at IMC 2012

The paper “Towards Geolocation of Millions of IP Addresses” was accepted by IMC 2012 in Boston, MA (available at http://www.isi.edu/~johnh/PAPERS/Hu12a.html).

From the abstract:

Previous measurement-based IP geolocation algorithms have focused on accuracy, studying a few targets with increasingly sophisticated algorithms taking measurements from tens of vantage points (VPs). In this paper, we study how to scale up existing measurement-based geolocation algorithms like Shortest Ping and CBG to cover the whole Internet. We show that with many vantage points, VP proximity to the target is the most important factor affecting accuracy. This observation suggests our new algorithm that selects the best few VPs for each target from many candidates. This approach addresses the main bottleneck to geolocation scalability: minimizing traffic into each target (and also out of each VP) while maintaining accuracy. Using this approach we have currently geolocated about 35% of the allocated, unicast, IPv4 address-space (about 85% of the addresses in the Internet that can be directly geolocated). We visualize our geolocation results on a web-based address-space browser.

Citation: Zi Hu and John Heidemann and Yuri Pradkin. Towards Geolocation of Millions of IP Addresses. In Proceedings of the ACM Internet Measurement Conference, p. to appear. Boston, MA, USA, ACM. 2012. <http://www.isi.edu/~johnh/PAPERS/Hu12a.html>


Categories
Papers Publications

New Workshop paper “Visualizing Sparse Internet Events: Network Outages and Route Changes”


The paper “Visualizing Sparse Internet Events: Network Outages and Route Changes” was accepted by WIV’12 in Boston, MA (available at http://www.isi.edu/~johnh/PAPERS/Quan12b.html).

From the abstract:

To understand network behavior, researchers and enterprise network operators must interpret large amounts of network data. To understand and manage network events such as outages, route instability, and spam campaigns, they must interpret data that covers a range of networks and evolves over time. We propose a simple clustering algorithm that helps identify spatial clusters of network events based on correlations in event timing, producing 2-D visualizations. We show that these visualizations where they reveal the extent, timing, and dynamics of network outages such as January 2011 Egyptian change of government, and the March 2011 Japanese earthquake. We also show they reveal correlations in routing changes that are hidden from AS-path analysis.

Citation: Lin Quan and John Heidemann and Yuri Pradkin. Visualizing Sparse Internet Events: Network Outages and Route Changes. In Proceedings of the First ACM Workshop on Internet Visualization. Boston, MA. November, 2012. <http://www.isi.edu/~johnh/PAPERS/Quan12b.html>.

Categories
Announcements

IP Geolocation in our Browsable IPv4 Map

We’re happy to announce that our browsable Internet map at http://www.isi.edu/ant/address/browse/ now includes IP geolocation.

We plot the latitude and longitude of each IP address around the world as a specific color, placing them on our IPv4 map (the zoomable Hilbert curve).  Thus we can show how blocks of IPv4 addresses map (above) to the globe (below).

AMITE Geolocation of IPv4 as of 2012-06-28
Hue and lightness to longitude and latitude.

On the IP map, we show latitude/longitude by color.  For each address, the longitude is the hue (the colors around the rainbow), so North America is blue; South America, fuschia; Europe and Africa, red; and Asia to Australia yellow to green.  The latitude controls lightness, so things north of the equator are darker, while those south of the equator are lighter. Thus Japan is dark green, while Australia is teal, and Scandanavia is dark read, while south Africa is orange.  (We have released the source code to do this mapping with a BSD license.)

The IP map shows IP all 4 billion addresses on the Hilbert curve.  We have discussed this mapping before (see our poster).

Our IP map is zoomable and draggable, so one can look at particular regions of interest.  For example, here is 128/8, including ISI (in Los Angeles, dark blue), between UC San Diego (also dark blue) and University of Maryland (US east coast, so purple), while the Fininnish University of Helsinki is dark brown, and the Australian University of Melboure is lime green.

Annotated IPv4 geolocation

Our geolocation data comes from three sources:

All of these geolocation sources have varying levels of accuracy, however we hope that the ability to visually relate IP addresses (onthe Hilbert curve) with geolocation (via latitude and longitude as shownby color) provides a fresh look at IP addresses and their locations.

This geolocation work is due to Zi Hu, Yuri Pradkin, and John Heideman.  This work and visualization has been supported by the AMITE project through DHS, and the data (both processed geolocation results and raw data if you can improve our accuracy) will be available through the LANDER project’s datasets and the PREDICT program.