Categories
Papers Publications

New conference paper “Detecting Encrypted Botnet Traffic” at Global Internet 2013

The paper “Detecting Encrypted Botnet Traffic” was accepted by Global Internet 2013 in Turin, Italy (available at http://www.netsec.colostate.edu/~zhang/DetectingEncryptedBotnetTraffic.pdf)

From the abstract:

Bot detection methods that rely on deep packet in- spection (DPI) can be foiled by encryption. Encryption, however, increases entropy. This paper investigates whether adding high- entropy detectors to an existing bot detection tool that uses DPI can restore some of the bot visibility. We present two high-entropy classifiers, and use one of them to enhance BotHunter. Our results show that while BotHunter misses about 50% of the bots when they employ encryption, our high-entropy classifier restores most of its ability to detect bots, even when they use encryption.

This work is advised by Christos Papadopolous and Dan Massey at Colorado State University.

Categories
Presentations

new talk “Long-term Data Collection and Analysis of Outages at the Edge” given at the AIMS workshop

John Heidemann gave the talk “Long-term Data Collection and Analysis of Outages at the Edge” at UCSD, San Diego, California on Feb. 8, 2013 as part of the CAIDA Active Internet Measurement Systems (AIMS) Workshop.  Slides are available at http://www.isi.edu/~johnh/PAPERS/Heidemann13e.html.

talk_icon

This talk describes our analysis of outages in edge networks at the time of Hurricane Sandy, and how that work was enabled by long-term data collection. The analysis showed U.S. networks had double the outage rate (from 0.2% to 0.4%) on 2012-10-30, the day after Sandy landfall, and recovered after four days. We highlighted long-term data collection of Internet Surveys, a random sample of about 41,000 /24 blocks, and the characteristics that make that data suitable for re-analysis. The talk was part of the CAIDA Workshop on Active Internet Measurement Systems, hosted at UCSD.

This work is based on our recent technical report   “A Preliminary Analysis of Network Outages During Hurricane Sandy“, joint work of John Heidemann, Lin Quan, and Yuri Pradkin.

Categories
Presentations

new abstract “Third-Party Measurement of Network Outages in Hurricane Sandy” and talk with video at FCC Workshop on Network Resiliency

We recently posted our abstract “Third-Party Measurement of Network Outages in Hurricane Sandy” at http://www.isi.edu/~johnh/PAPERS/Heidemann13c.html and the talk “Active Probing of Edge Networks: Hurricane Sandy and Beyond” at http://www.isi.edu/~johnh/PAPERS/Heidemann13d.html

These were part of the FCC Workshop on Network Resiliency at Brooklyn Law College, Brooklyn, NY on Feb. 6, 2013, chaired by Henning Schulzrinne.

Video from our talk and for the whole workshop is on YouTube.

fcc_youtube

A summary of the talk:

This talk summarized our analysis of outages in edge networks at the time of Hurricane Sandy. This analysis showed U.S. networks had double the outage rate (from 0.2% to 0.4%) on 2012-10-30, the day after Sandy landfall, and recovered after four days. It also describes our goal of tracking all outages in the Internet. The talk was part of the FCC workshop on Network Resiliency, hosted at Brooklyn Law College by Henning Schulzrinne.

This work is based on our recent technical report   “A Preliminary Analysis of Network Outages During Hurricane Sandy“, joint work of John Heidemann, Lin Quan, and Yuri Pradkin.


Categories
Presentations

New Talk “A Fresh Look At Scalable Forwarding Through Router FIB Caching”

Kaustubh Gadkari gave a talk on “A Fresh Look At Scalable Forwarding Through Router FIB Caching” at NANOG57 in Orlando, FL. Slides for the talk are available in pptx or pdf.

Kaustubh Gadkari at Nanog57This talk presented current research into the possibility of employing caching on router FIBs to reduce the amount of FIB memory required to forward packets. Our analysis shows that 99%+ packets can be forwarded from the cache with a cache size of 10,000 entries. Packets that caused cache misses were TCP SYNs and SYNACKs; no data packets were queued. Our analysis also shows that our caching system is robust against attacks against the cache.

This work is part of our ongoing work on the analysis of FIB caching, being advised by Christos Papadopolous and Dan Massey at Colorado State University.

Categories
Presentations

new talk “Active Probing of Edge Networks: Outages During Hurricane Sandy” at NANOG57

John Heidemann gave the talk “Active Probing of Edge Networks: Outages During Hurricane Sandy” at NANOG57 in Orlando Florida on Feb. 5, 2013 as part of a panel on Hurricane Sandy, hosted by James Cowie at Renesys.  Slides are available at http://www.isi.edu/~johnh/PAPERS/Heidemann13b.html.

m2051752.small

This talk summarizes our analysis of outages in edge networks at the time of Hurricane Sandy. This analysis showed U.S. networks had double the outage rate (from 0.2% to 0.4%) on 2012-10-30, the day after Sandy landfall, and recovered after four days. The talk was part of the panel “Internet Impacts of Hurricane Sandy”, moderated by James Cowie, with presentations by John Heidemann, USC/Information Sciences Institute; Emile Aben, RIPE NCC; Patrick Gilmore, Akamai; Doug Madory, Renesys.

This work is based on our recent technical report   “A Preliminary Analysis of Network Outages During Hurricane Sandy“, joint work of John Heidemann, Lin Quan, and Yuri Pradkin.


Categories
Publications Technical Report

new tech report “A Preliminary Analysis of Network Outages During Hurricane Sandy”

We just released a new technical report “A Preliminary Analysis of Network Outages During Hurricane Sandy”, available at ftp://ftp.isi.edu/isi-pubs/tr-685.pdf and at http://www.isi.edu/~johnh/PAPERS/Heidemann12d.pdf.

From the abstract:

This document describes our analysis of Internet outages during the October 2012 Hurricane Sandy. We assess network reliability by pinging a sample of networks and observing those that respond and then stop responding. While there are always occasional network outages, we see that the outage rate in U.S. networks doubled when the hurricane made landfall, then took about four days to recover. We confirm that this increase was due to outages in New York and New Jersey.

Categories
Papers Publications

New conference paper “Towards Geolocation of Millions of IP Addresses” at IMC 2012

The paper “Towards Geolocation of Millions of IP Addresses” was accepted by IMC 2012 in Boston, MA (available at http://www.isi.edu/~johnh/PAPERS/Hu12a.html).

From the abstract:

Previous measurement-based IP geolocation algorithms have focused on accuracy, studying a few targets with increasingly sophisticated algorithms taking measurements from tens of vantage points (VPs). In this paper, we study how to scale up existing measurement-based geolocation algorithms like Shortest Ping and CBG to cover the whole Internet. We show that with many vantage points, VP proximity to the target is the most important factor affecting accuracy. This observation suggests our new algorithm that selects the best few VPs for each target from many candidates. This approach addresses the main bottleneck to geolocation scalability: minimizing traffic into each target (and also out of each VP) while maintaining accuracy. Using this approach we have currently geolocated about 35% of the allocated, unicast, IPv4 address-space (about 85% of the addresses in the Internet that can be directly geolocated). We visualize our geolocation results on a web-based address-space browser.

Citation: Zi Hu and John Heidemann and Yuri Pradkin. Towards Geolocation of Millions of IP Addresses. In Proceedings of the ACM Internet Measurement Conference, p. to appear. Boston, MA, USA, ACM. 2012. <http://www.isi.edu/~johnh/PAPERS/Hu12a.html>


Categories
Papers Publications

New Workshop paper “Visualizing Sparse Internet Events: Network Outages and Route Changes”


The paper “Visualizing Sparse Internet Events: Network Outages and Route Changes” was accepted by WIV’12 in Boston, MA (available at http://www.isi.edu/~johnh/PAPERS/Quan12b.html).

From the abstract:

To understand network behavior, researchers and enterprise network operators must interpret large amounts of network data. To understand and manage network events such as outages, route instability, and spam campaigns, they must interpret data that covers a range of networks and evolves over time. We propose a simple clustering algorithm that helps identify spatial clusters of network events based on correlations in event timing, producing 2-D visualizations. We show that these visualizations where they reveal the extent, timing, and dynamics of network outages such as January 2011 Egyptian change of government, and the March 2011 Japanese earthquake. We also show they reveal correlations in routing changes that are hidden from AS-path analysis.

Citation: Lin Quan and John Heidemann and Yuri Pradkin. Visualizing Sparse Internet Events: Network Outages and Route Changes. In Proceedings of the First ACM Workshop on Internet Visualization. Boston, MA. November, 2012. <http://www.isi.edu/~johnh/PAPERS/Quan12b.html>.

Categories
Announcements

IP Geolocation in our Browsable IPv4 Map

We’re happy to announce that our browsable Internet map at http://www.isi.edu/ant/address/browse/ now includes IP geolocation.

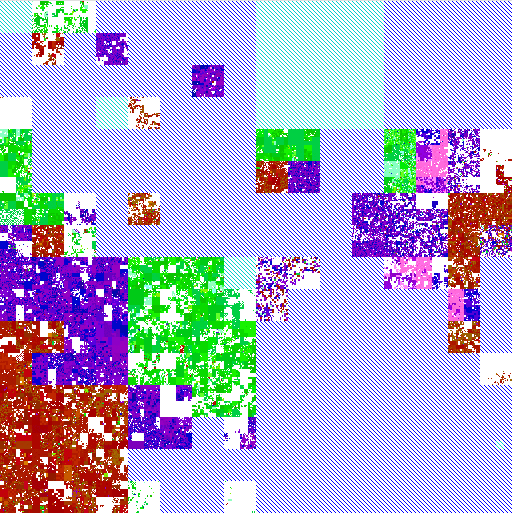
We plot the latitude and longitude of each IP address around the world as a specific color, placing them on our IPv4 map (the zoomable Hilbert curve).  Thus we can show how blocks of IPv4 addresses map (above) to the globe (below).

AMITE Geolocation of IPv4 as of 2012-06-28
Hue and lightness to longitude and latitude.

On the IP map, we show latitude/longitude by color.  For each address, the longitude is the hue (the colors around the rainbow), so North America is blue; South America, fuschia; Europe and Africa, red; and Asia to Australia yellow to green.  The latitude controls lightness, so things north of the equator are darker, while those south of the equator are lighter. Thus Japan is dark green, while Australia is teal, and Scandanavia is dark read, while south Africa is orange.  (We have released the source code to do this mapping with a BSD license.)

The IP map shows IP all 4 billion addresses on the Hilbert curve.  We have discussed this mapping before (see our poster).

Our IP map is zoomable and draggable, so one can look at particular regions of interest.  For example, here is 128/8, including ISI (in Los Angeles, dark blue), between UC San Diego (also dark blue) and University of Maryland (US east coast, so purple), while the Fininnish University of Helsinki is dark brown, and the Australian University of Melboure is lime green.

Annotated IPv4 geolocation

Our geolocation data comes from three sources:

All of these geolocation sources have varying levels of accuracy, however we hope that the ability to visually relate IP addresses (onthe Hilbert curve) with geolocation (via latitude and longitude as shownby color) provides a fresh look at IP addresses and their locations.

This geolocation work is due to Zi Hu, Yuri Pradkin, and John Heideman.  This work and visualization has been supported by the AMITE project through DHS, and the data (both processed geolocation results and raw data if you can improve our accuracy) will be available through the LANDER project’s datasets and the PREDICT program.


Categories
Publications Technical Report

New Tech Report “An Organization-Level View of the Internet and its Implications (extended)”

We just published a new technical report “An Organization-Level View of the Internet and its Implications (extended)”, available at ftp://ftp.isi.edu/isi-pubs/tr-679.pdf.
From the abstract:

We present a new clustering approach for mapping ASes to organizations, to develop an organization-level view of the Internet’s AS ecosystem. We demonstrate that the choice of clustering method and use of a new (though unconventional) data source in the form of company subsidiary information contained in the U.S. SEC~Form 10-K filings are both essential to get accurate results. Evaluating our mapping and validating it against carefully chosen datasets shows few (less than 10%) false negatives for 90% of organizations and few false positives for 60% of our organizations. We apply our map to show the importance of an organization-level view of the Internet by contrasting it with the commonly-used view that considers only an organization’s “main” AS. We find that this main-AS view sometimes severely underrepresents the influence of an organization in terms of announced addresses, geographic footprint, and peerings at Internet eXchange Points (IXPs). For example, for 20% of our organizations, the main-AS view detects only 10-60% of the cities covered by the corresponding organization-level view.