ANT Censuses of the Internet Address Space
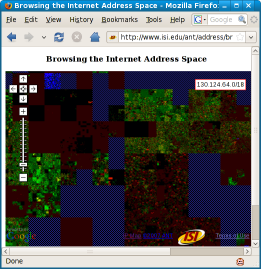
Starting in 2003, researchers at ISI have been collecting data about the Internet address space. As part of this work we have been probing all addresses in the allocated Internet address space. This web page summarizes this research, the datasets, and related papers. We also have a plot of the entire internet at scale (one dot is one address), an interactive, browsable map (details), and video description, and (new Jan. 2015) an animation showing 8 years of Internet censuses.
A Census of the Internet Address Space
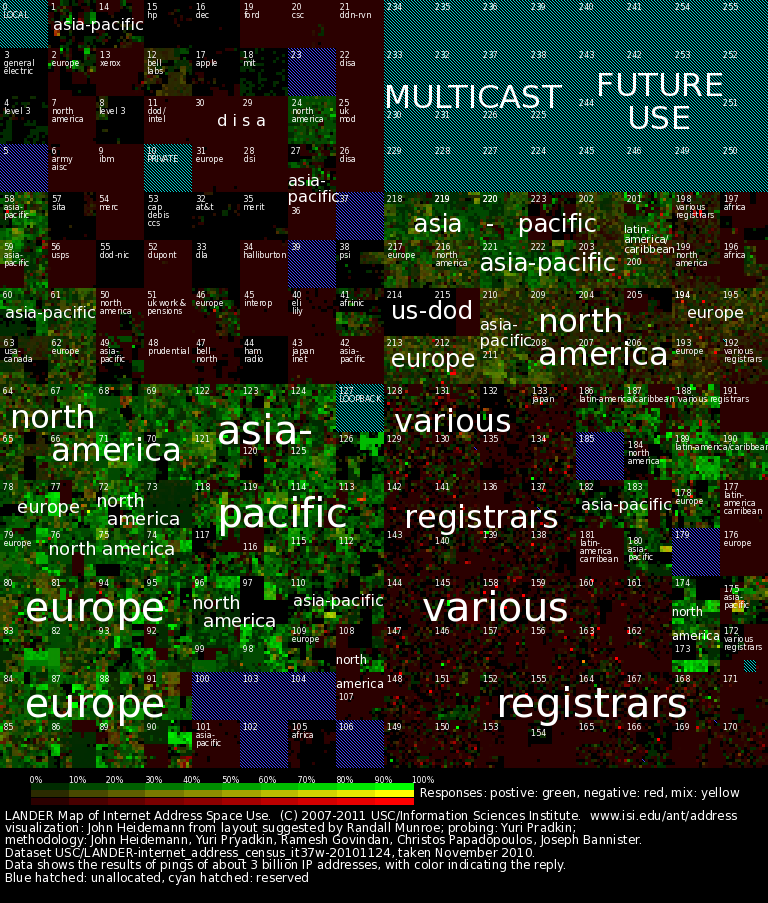
[A census of allocated addresses, Nov. 2010, (C) 2010 by USC, from the LANDER project. The above map shows dataset USC/LANDER-internet_address_survey_it37w-20101124.]
 The figure above shows our map of the allocated address space.
They layout follows Randall Munroe's hand-drawn map of allocated Internet address blocks from
xkcd #195.
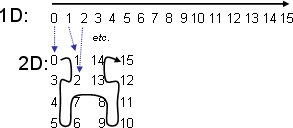
We convert the one-dimensional, 32-bit addresses into two dimensions using a Hilbert Curve, as shown to the right. This curve keeps adjacent addresses physically near each other, and it is fractal, so we can zoom in or out to control detail.
The figure above shows our map of the allocated address space.
They layout follows Randall Munroe's hand-drawn map of allocated Internet address blocks from
xkcd #195.
We convert the one-dimensional, 32-bit addresses into two dimensions using a Hilbert Curve, as shown to the right. This curve keeps adjacent addresses physically near each other, and it is fractal, so we can zoom in or out to control detail.
Address Block Assignments
 Internet addresses are allocated in blocks of consecutive addresses.
The map above shows who controls each of the 256 numbered blocks
corresponding to /8 subnets.
Block number n represents the 16 million addresses
of the form n.x.y.z.
Blocks in the upper-left quarter were mostly assigned
to organizations before 1996,
while many of the other blocks are assigned through regional registries.
Internet addresses are allocated in blocks of consecutive addresses.
The map above shows who controls each of the 256 numbered blocks
corresponding to /8 subnets.
Block number n represents the 16 million addresses
of the form n.x.y.z.
Blocks in the upper-left quarter were mostly assigned
to organizations before 1996,
while many of the other blocks are assigned through regional registries.
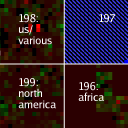
As an example, in this subset of the Internet map, two blocks (196/8 and 199/8) are allocated geographically, while 198/8 is used by many groups, and 197/8 is still unallocated. Geographic allocations can reduce routing table sizes.
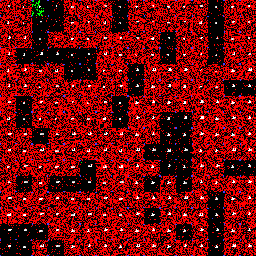
A Census of Allocated Addresses
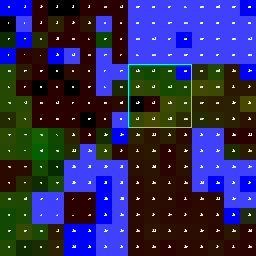
The colors in our Internet map shows our census of all allocated addresses. We send each address a request "are you there?" (an ICMP ping message) and record the result. In this map, each point represents the average response of a /16 subnet (65,536 addresses).
Color indicates how they reply, as shown in the legend at the bottom of the map: brighter indicates more replies, darker, fewer. Greener means more positive replies ("yes, I'm here"), redder indicates more negative replies ("not allowed", "router but no host", etc.). Yellow indicates a mix of positive and negative replies. (More details about exactly how colors are computed.) Hatching indicates areas that were not probed because they were not public, allocated, unicast address space (more details about what we probed and didn't probe)---dark blue hatching is unallocated, and cyan hatching is reserved (private, multicast, and class E).
![]()
(We've also plotted the census at scale, where one square is one address, using a slightly different color mapping,
and we have
an interactive, browsable map.)
About The Internet Address Space
Every computer on the global Internet uses an Internet Address. With the Internet Protocol, version 4 (IPv4), these addresses are a number between 0 and 232 (around 4 billion). IPv4 addresses are usually written with dotted-decimal notation, like 128.150.4.107, where each number represents an 8-bit part of the address. Computer names and websites like www.nsf.gov are converted to these addresses as part of using the Internet.
IPv4 addresses are collected into address blocks or subnets. All addresses in a subnet have the same initial bits (or prefix). The subnet 128/8 includes almost 17 million addresses from 128.0.0.0 to 128.255.255.255, while the subnet 128.150/16 includes only 65,536 addresses of the form 128.150.x.y.
Why Internet Addresses Matter
To exchange information over the Internet requires computers on both ends with Internet addresses. Almost all servers on the Internet have their own addresses, although multiple client computers sometimes share an address using network address translation (NAT).
IPv4 addresses are a limited resource. Today, more than half of the IPv4 addresses have been allocated. Current projections by Geoff Huston suggest that all will be allocated from IANA by 2011. A new protocol, IPv6, provides 2128 addresses to solve this shortage.
Understanding how addresses are used influences many aspects of the Internet. Routers are more efficient when they serve subnets with addresses with common prefixes. Worms explore the address space at random. Individuals use more addresses as they use the net in new ways, from more computers to mobile telephones or embedded devices.
Internet Census Taking
We believe we have taken the first census contacting each address of the visible Internet since 1982 (RFC-832). A census is an enumeration of all allocated addresses. We probed all 2.7 billion allocated addresses (compared to 315 in 1982). We are able to probe only the visible Internet: all addresses that use public addresses and choose to respond.Accuracy
No census of billions of addresses will be perfect; we underestimate occupancy for three reasons: A few percent of probes and replies are lost due to congestion. Addresses such as those behind firewalls choose not to receive or reply to our requests. Other computers use private addresses. We evaluate loss in our technical report; evaluation of the other cases, the invisible Internet, is future work.Data Privacy
Like street addresses, Internet addresses by themselves do not identify people. However, we publish results about the datasets that present only aggregate data, and that randomly permute any individual addresses to further protect privacy.Visualizing the Internet Space
It is difficult to visualize the status of all four billion Internet addresses at once. We use averaging and zooming to manage this space, as shown in the two sets of small maps below.
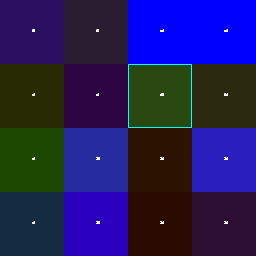
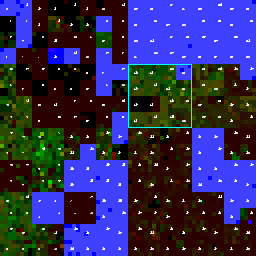
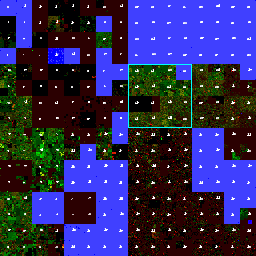
With averaging, each point summarizes the status of some number of addresses. In the four maps below the cyan box shows the same region of the Internet as the granularity of averaging becomes finer. At each step the cyan area stays the same, but inside are more points, each representing one-eight the number of addresses, from 270 million (first map below) to 65 thousand (last map below).
| the whole Internet; each point is a /4 subnet (270 million addresses) the cyan area is one point |
|
| the whole Internet; each point is a /8 subnet (16 million addresses) the cyan area is 16 points |
|
| the whole Internet; each point is a /12 subnet (1 million addresses) the cyan area is 256 points |
|
| the whole Internet; each point is a /16 subnet (65,536 addresses) the cyan area is 65,536 points |
|
We can zoom in on any part of the Internet address space and view that part at greater detail. In three maps below, the yellow lines indicate zooming on parts of the Internet. At each step less of the Internet is shown and each point represents fewer addresses, from the whole Internet at 65 thousand addresses per point, to just 1/1000th% of the Internet with each point representing a single address.
each point is a /16 subnet
(65,536 addresses)
will zoom on the yellow box

(0.5% of the internet);
each point is a /24 subnet (256 addresses)
will zoom on the yellow box
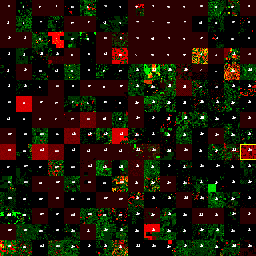
(0.001% of the internet);
each point is a single address (permuted)
will zoom on the yellow box
The Census by the Numbers
(This data is derived from dataset USC/LANDER-internet_address_survey_it37w-20101124, taken Nov. 2010. Values are rounded to three digits of precision.)
| address type | number | percent of all addresses |
percent of allocated unicast addresses |
|---|---|---|---|
| IPv4 addresses | 4,290 million | (100%) | -- |
| unprobed (hatched) | 773M | (18%) | -- |
| special: multicast, private, loopback, class E | 587M | (13%) | -- |
| unallocated | 186M | (4%) | -- |
| allocated and probed | 3,520M | (81%) | -- |
| replies | 266M | (6%) | (7.6%) |
| positive replies | 213M | (4%) | (6.1%) |
| negative replies | 54M | (1%) | (3.0%) |
| non-replies | 3,255M | (75%) | (92%) |
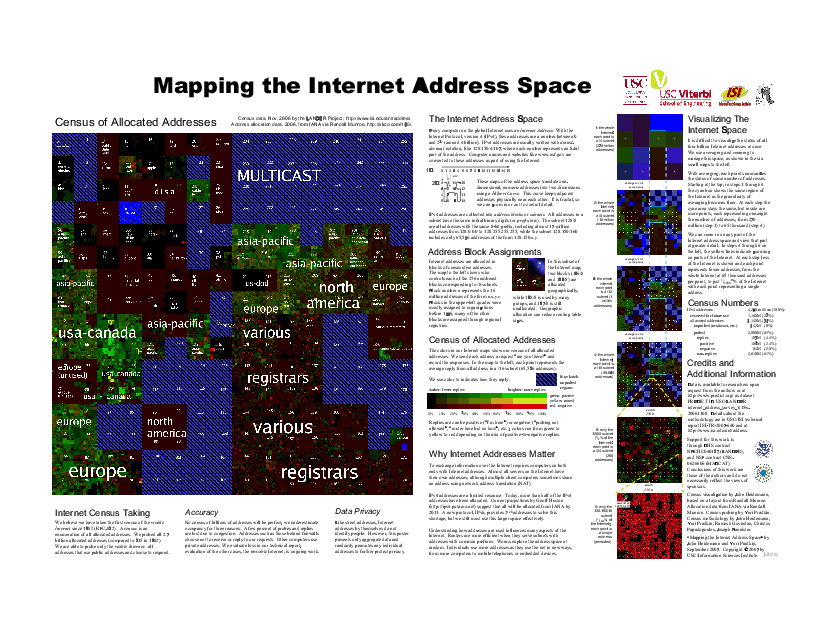
More Plots
We have a poster that captures this material in its 23x35" glory. Copies of this poster can be ordered from our AntPosters store at CafePress. (We are a research lab; CafePress handles printing and mailing for us. As of October 2007, their price is $19.99 for the poster plus $4 shipping and handling in the US.)
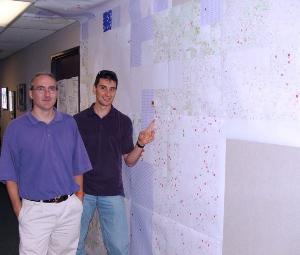
We have also plotted the whole Internet at scale (one pixel is one host). The whole-internet poster is not generally available at this time, but contact us at the e-mail address listed below for any special requests.
And we have an interactive, browsable map.
About our work
Technical documents describing this data:
-
John Heidemann, Yuri Pradkin, Ramesh Govindan, Christos Papadopoulos, Genevieve Bartlett, and Joseph Bannister.
Census and Survey of the Visible
Internet In Proceedings of the ACM Internet Measurement
Conference, p. to appear. Vouliagmeni, Greece, ACM. October, 2008.
-
John Heidemann, Yuri Pradkin, Ramesh Govindan, Christos Papadopoulos, and Genevive Bartlett, and Joseph Bannister.
A peer-reviewed description of our methodology.
(An extended version is in the Feb. 2008 technical report listed below.)
-
John Heidemann, Yuri Pradkin, Ramesh Govindan, Christos Papadopoulos, and Genevive Bartlett, and Joseph Bannister.
Census and Survey of the Visible Internet (extended). Technical Report ISI-TR-2008-649, USC/Information Sciences Institute, February, 2008.
- "Mapping the Internet Address Space" (poster). John Heidemann and Yuri Pradkin, August 2007. USC/Information Sciences Institute.
- John Heidemann, Yuri Pradkin, Ramesh Govindan, Christos Papadopoulos, and Joseph Bannister. Exploring Visible Internet Hosts through Census and Survey. Technical Report ISI-TR-2007-640, USC/Information Sciences Institute, May, 2007. (This technical report is now superceeded by ISI-TR-2008-649.)
For more information about our group's research, please see our publications web page.
High resolution images of our address space maps are available upon request. Please contact John Heidemann for details.
Details about the methodology are in USC/ISI technical report ISI-TR-2007-640 and at https://ant.isi.edu/address.
Dataset Availability
Our address space censuses and surveys are available to researchers upon request from the authors or through PREDICT; or see the LANDER dataset page and a description of datasets used in our maps.
Related Work
Mapping the Internet Address Space: While many people have mapped the Internet topology, Randall Munroe popularized plots of address space allocation on a Hilbert curve in xkcd #195.Brian Cort reported on Sierpinski curve plots of the address space allocation data at the Art Exhibit section IEEE InfoVis 2006 in Oct/Nov 2006. This work therefore is slightly earlier than xkcd. (To my knowledge, the xkcd work was independent of Cort's early work.)
Hourann Bosci created map-o-net, placing individual addresses on Munroe's map, and Dylan Alex Simon created a browsable and zoomable version of block allocations.
Duane Wessels (Measurement Factory) and k. claffy at CAIDA have created similar maps from BGP data and open DNS resolvers data they have collected. (They also produced graphs of our address space using their rendering.)
Duane Wessels (Measurement Factory) and k. claffy at CAIDA have also done animations looking at how address usage and allocation changes over time (using all of our datasets, not just the one we plot above). Very cool stuff!
Address censuses: David Smallberg conducted a census of the Internet in 1982, see RFC-832.
We believe we are the first to conduct an Internet census by directly contacting hosts since then.
ISC has been taking censuses of the reverse address space since 1994. They contact name servers to determine reverse-name mappings for addresses, rather than contacting hosts themselves. Unlike our approach, they are not affected directly by firewalls, but they can overcount because names may exist for addresses not in use, and undercount, because addreses may lack reverse name mappings, or reverse mappings not made public (perhaps for firewalled hosts). Because their methodology is so different from ours, the approaches are complementary and we are very interested in comparing results. Their January 2007 survey is just after our November 2006 data (plotted above), and it found 433M reverse names, compared to our 187M responsive addresses.
Address surveys: Multiple groups (including us) have taken surveys of the Internet address space, where they ping some fraction of the Internet. Robin Whittle has been surveying the Internet to understand utilization since March 2007. He looks at address utilization in the context of IPv4/v6 transition.
Other example include Skitter and now Ark from CAIDA. Their approaches focus on measuring latency, topology, and routing, not on the edge hosts that we study.
Credits and Support Information for Our Work
Support for this work is through DHS contract NBCHC040137 (the LANDER project) as part of the PREDICT program, and NSF contract CNS-0626606 (the MADCAT project). Conclusions of this work are those of the authors and do not necessarily reflect the views of sponsors.
Our visualizations of the Internet address space use the Hilbert layout inspired by by Randall Munroe in xkcd #195. Census visualization by John Heidemann. Census probing by Yuri Pradkin. Census methodology by John Heidemann, Yuri Pradkin, Ramesh Govindan, Christos Papadopoulos, Joseph Bannister.