
 |
Plotting the Whole Internet |
|---|
Following on our visualizations of our census data of the Internet address space, we plotted the whole Internet at scale in October 2007. By ``at scale'' we mean one pixel is one address and every single address is shown. At 600 dots-per-inch (typical printer resolution), the plot turns out to be about 83 square feet (7.7 m2, about 9 feet or 2.8m on a side!).
For a complete description of how the figure is laid out, see our web page about our Internet censuses. The colors for each address indicate the response, with green indicating positive responses ("I'm here"), red is a negative reply ("not allowed", "router but no host", etc.). White indicates no response to our probe. Blue indicates areas that were not probed because they were not public allocated unicast address space.
We cannot reproduce the figure here because web browsers aren't too happy with images this size, but here are some photos of it at ISI and in L.A.:
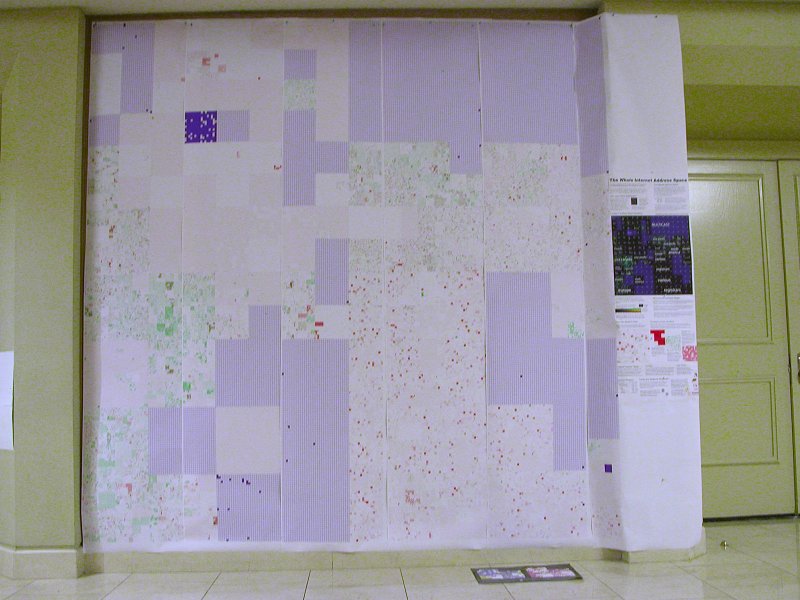
The whole Internet, plotted at scale, with a door to the right for reference.
This image is our Halloween reprint of the whole Internet that was
on display at the 30th ICANN meeting at the LAX Hilton.
The Hilton has 9' ceilings, so you can see the poster just fits.
Thanks to Kim Davies of ICANN for setting this up, and to Joe Kemp and Jeanine Yamazaki of ISI for reprinting it, and to Carl Staelin of HP for advice about printing.
Photo by John Heidemann.
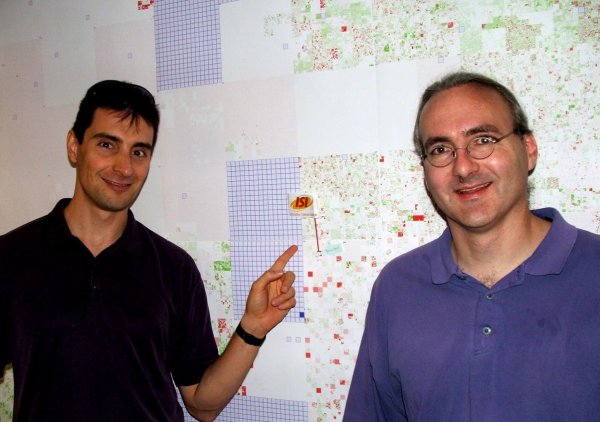
John and Yuri in front of the center of the Internet (above).
Yuri is pointing at 128.9/16, ISI's part of the Internet,
demonstrating that ISI is very nearly at the center of the net.
(This result is actually not an accident.
ISI has been involved in Internet research since 1972.
ISI participated in the transition from NCP to IPv4.
As a result, ISI got space near the beginning of class B address space
(back when classful addressing was used),
and class B space started at 128.0.0.0, the center of the Internet on a Hilbert curve.
Photo by Eric Mankin.
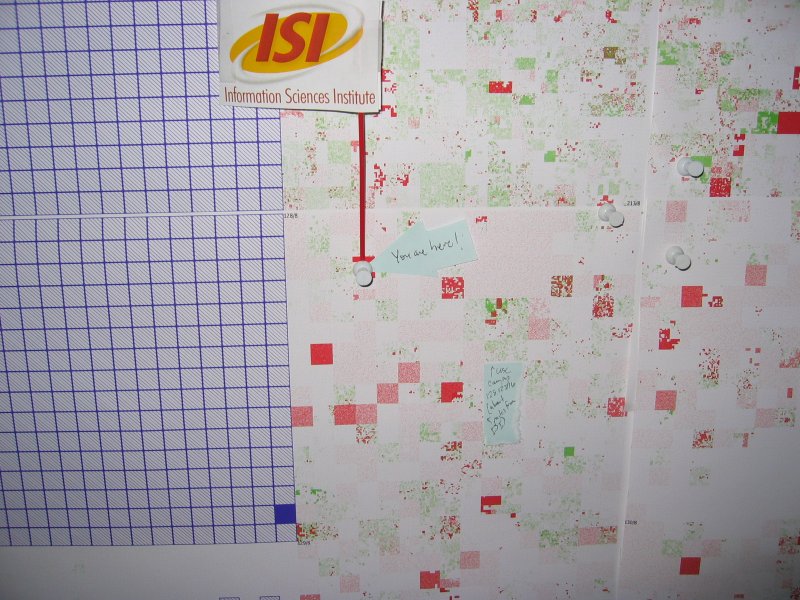
The center of the Internet without annoying people obscuring most of it.
Photo by John Heidemann.
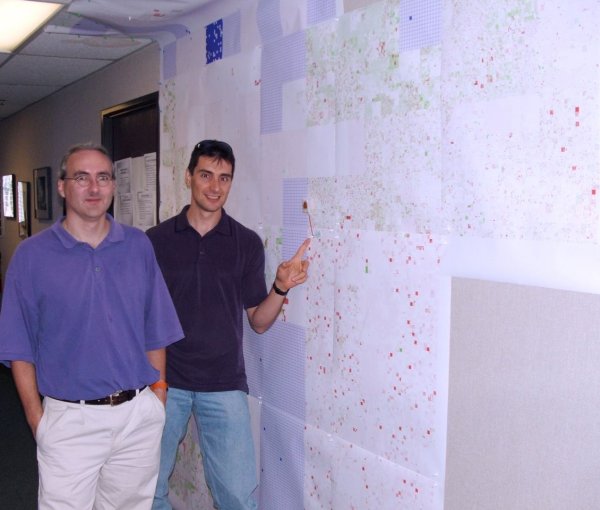
John and Yuri in front of the whole Internet (above). At this point only 65% has been printed (so the lower right has missing sections). Yuri is pointing at 128.9/16 (ISI's part of the space). Looking at the ceiling, you can see that ISI is apparently not big enough for the whole Internet--since the 9 foot height is taller than our 8 foot ceilings, the Internet wraps on to the ceiling. Photo by Eric Mankin.
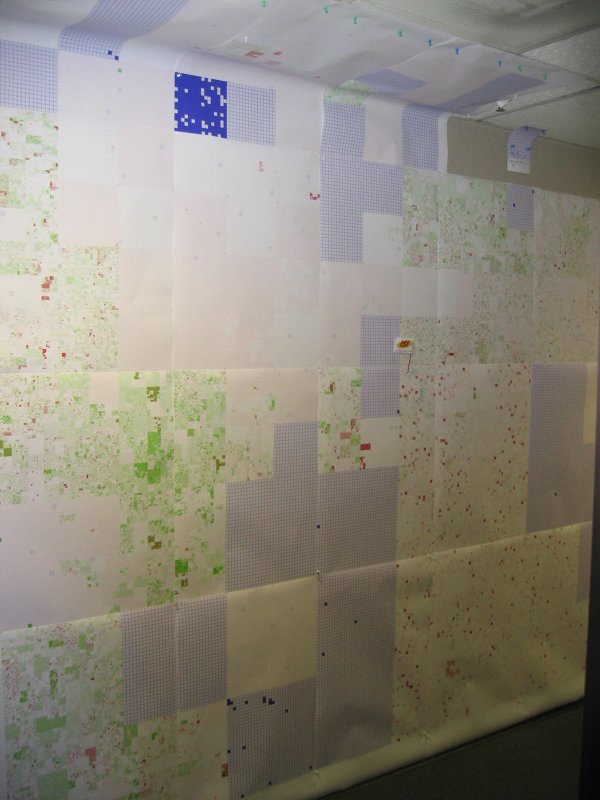
An unobstructed view of nearly the whole Internet.
Photo by John Heidemann.
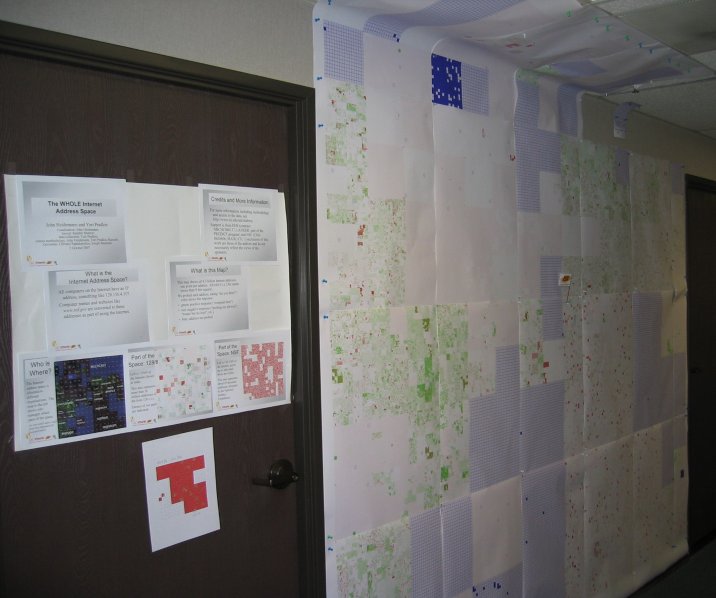
Our original view of the whole Internet, plotted at scale, with a door for reference.
Looking at the ceiling, you can see that ISI is apparently not big enough for the whole Internet--since the 9 foot height is taller than our 8 foot ceilings, the Internet wraps on to the ceiling.
Photo by John Heidemann.
The plot took about 16 hours to generate. The computation required 18 computers (52 cores) using the Hadoop implementation of map/reduce. We printed it as 20 sections, each 24x36 inches, each taking about between 1 and 2 hours to download to the printer and print. Both the computation and printing have significant room for speed improvements. We later reprinted it as 5 sections, each 24 inches wide and about 10 feet long.
Support for this work is through DHS contract NBCHC040137 (the LANDER project) as part of the PREDICT program, and NSF contract CNS-0626606 (the MADCAT project). Conclusions of this work are those of the authors and do not necessarily reflect the views of sponsors.
Our visualizations of the Internet address space use the Hilbert layout first used by Randall Munroe in xkcd #195. Census visualization by John Heidemann. Census probing by Yuri Pradkin. Census methodology by John Heidemann, Yuri Pradkin, Ramesh Govindan, Christos Papadopoulos, Joseph Bannister.
