I’ve been using matplotlib to generate figures for papers and other exploratory analysis, and I’ve finally started to compile a list of reasonably sane defaults and utility functions to make generating figures for papers easier and more consistent in style: matplotlib-config.
Over the years, I’ve run into several problems with inconsistent styles (those minor tweaks to each figure result in messy and fragile code, overall), bit rot (matplotlib deprecated/changed the behavior of its API across versions), and fonts (the ACM paper format checker will complain about any use of Type3 fonts).
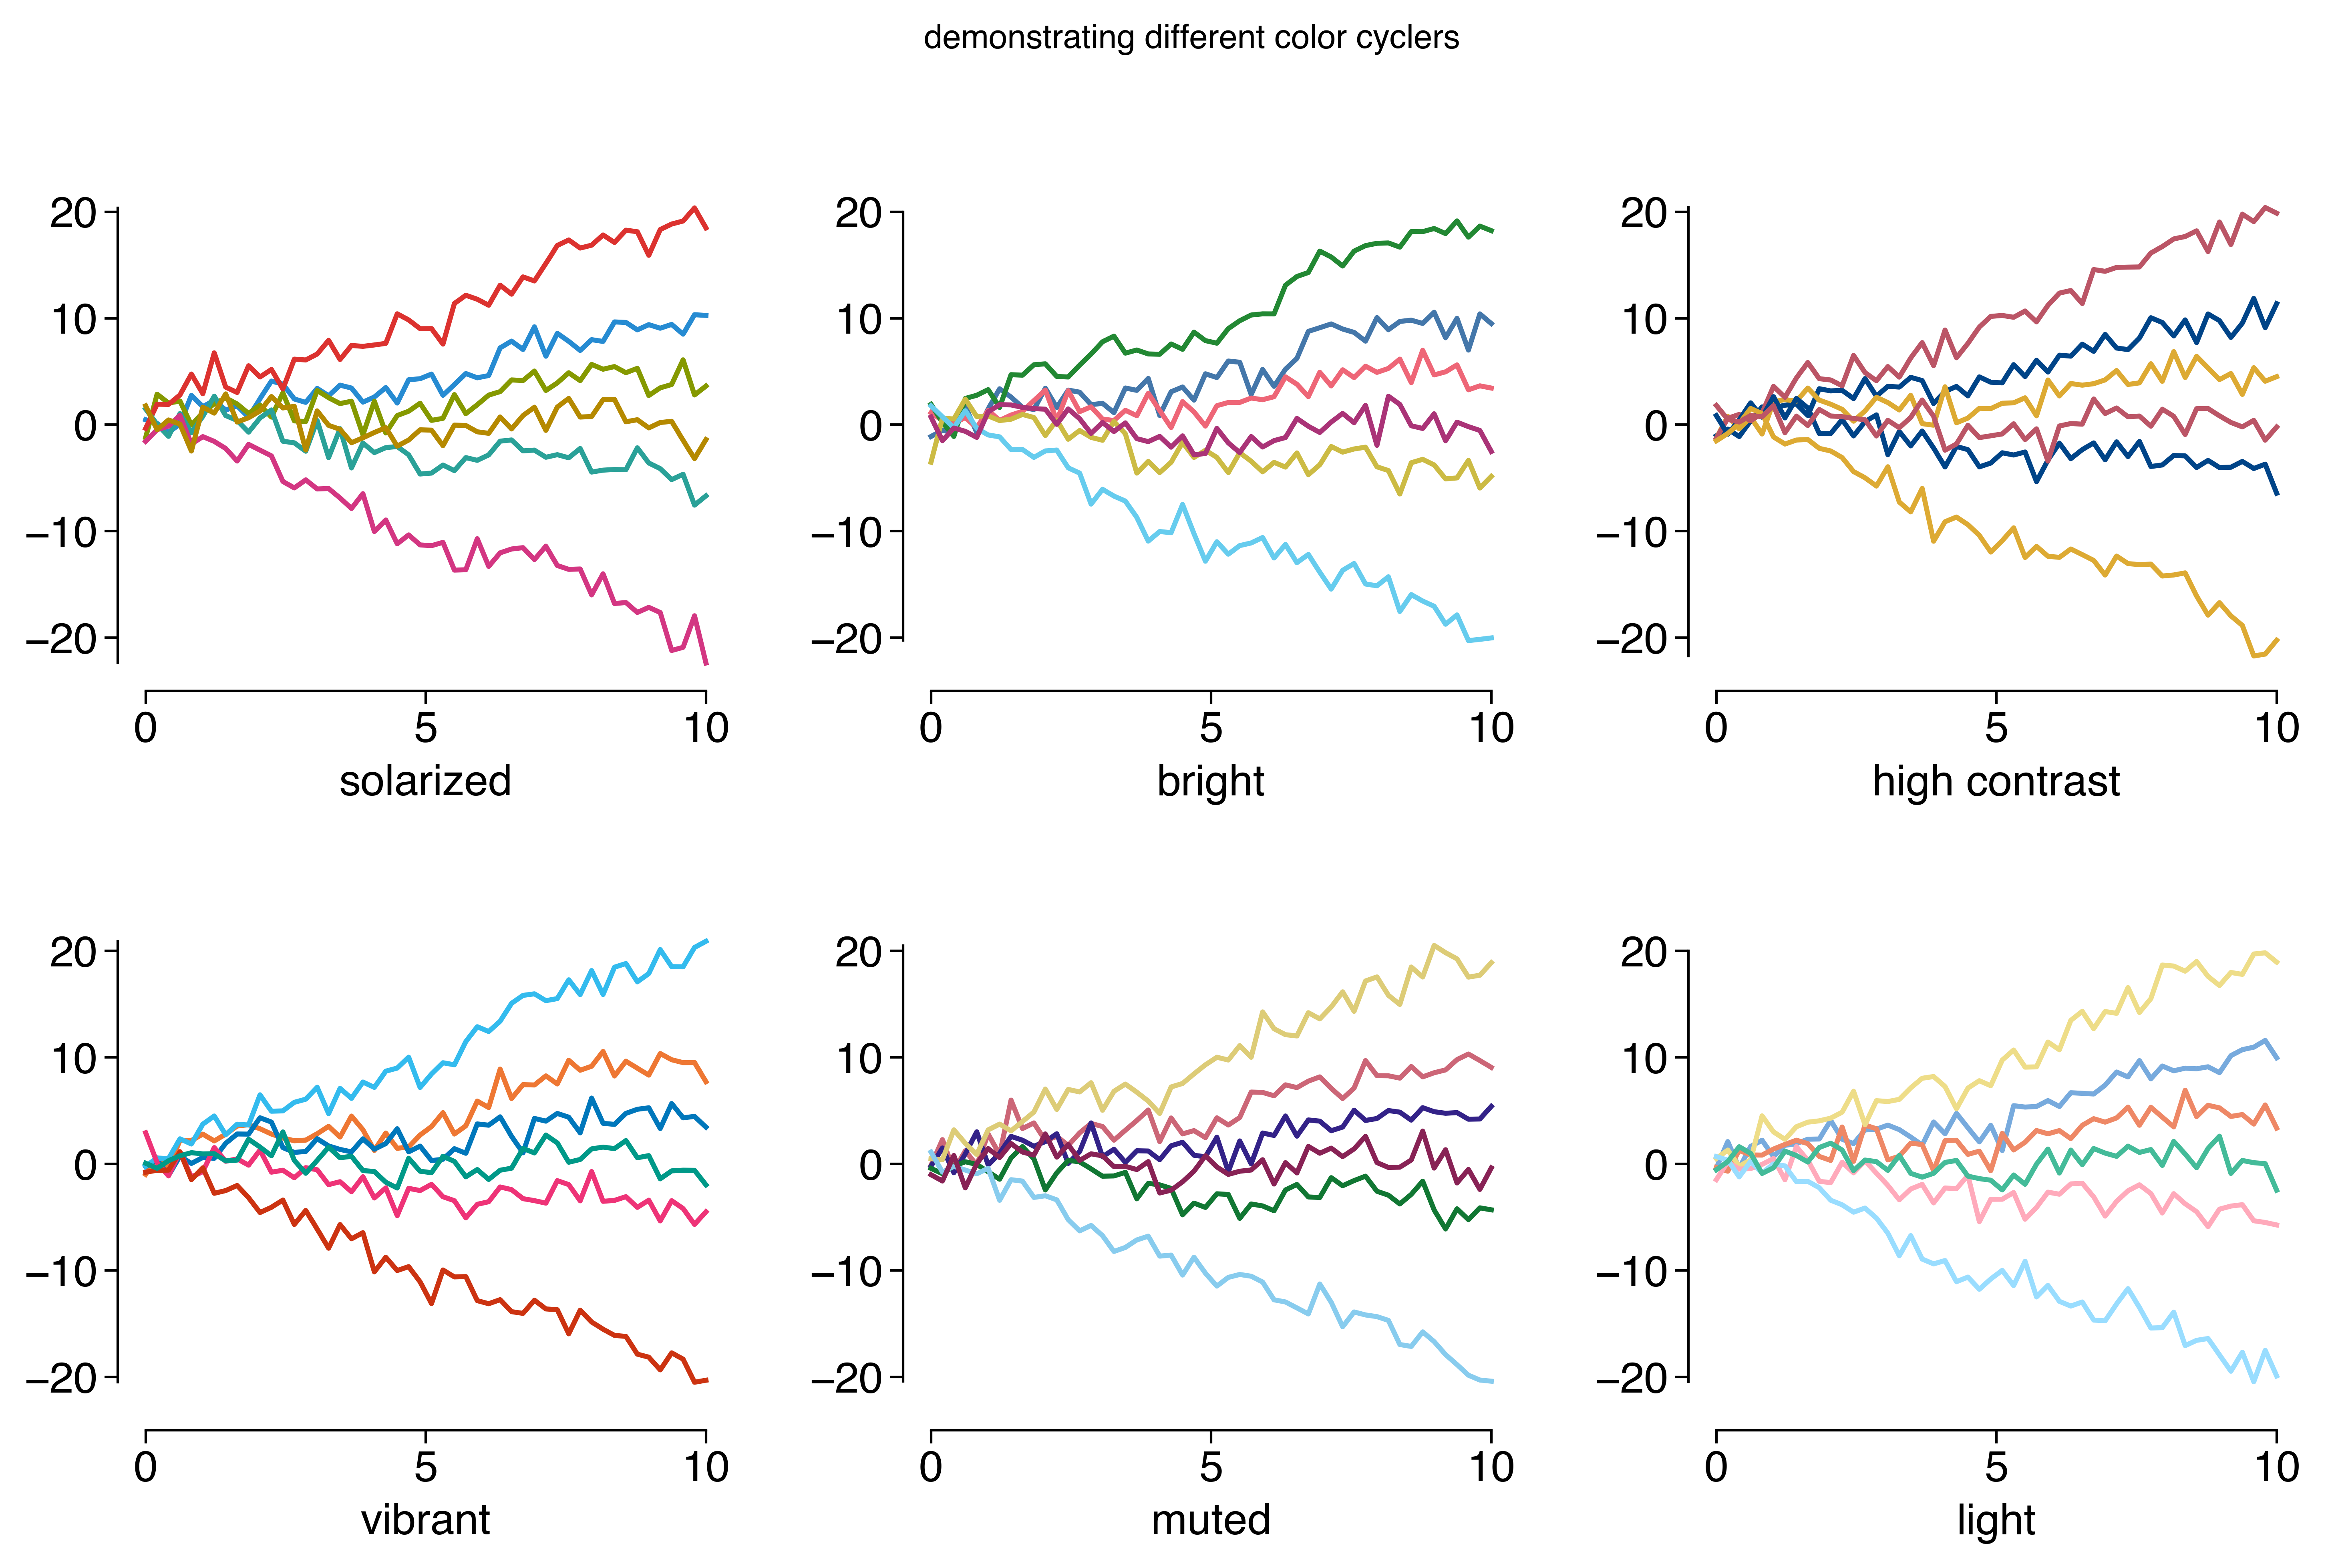
matplotlib-config is a Python 3+ module you can import and use with matplotlib 3+ and provides helpful functions to initialize the style of your figures, from fonts (Type1, Helvetica) to good default color schemes for data (from the choices and research done by Paul Tol).
An example showing the available color schemes:
The source code, documentation, and examples can be found on GitHub.
Please send any comments, bugs, fixes, or suggestions to cardi@acm.org.